 |
BMe Research
Grant |

|


György Oláh Doctoral School of Chemistry
Department of Organic Chemistry and Technology
Supervisor: Prof. György Marosi
Combined application of chemical imaging and multivariate data analysis (chemometrics) in pharmaceutical and environmental development
Introducing the research area
Chemical imaging is a
fairly novel, continuously growing non-invasive analytical method, which is one
of the most rapidly developing techniques in spectrometry. Its wide range of
applications (both in research and in technological development) include the
analysis of semiconductors [1], medicinal samples [2], paper products [3], food products [4], polymers [5] and pharmaceuticals [6-7]. Since this field poses challenges both in terms of
measurement systems and data evaluation, it seemed and proved an interesting topic for my PhD
studies.
Brief introduction of the research place
The Technology of Pharmaceutical,
Environmental and Safety Materials Research Group, located within the Department of Organic Chemistry and
Technology, conducts various research projects in the development of novel
pharmaceutical technologies [8], upcycling (recycling with
improved value) of polymers [9] and flame retardancy of polymers and structural materials
[10]. Although these areas might seem to be rather
different from one another, they have in fact a lot in common regarding theory
as well as methodology. The research group has access to a wide range of
analytical equipment.
History and context of the research
Chemical imaging is a branch of vibrational spectrometry, since the equipment capable of such analyses comprise a vibrational (infrared, near infrared or Raman) spectrometer and appropriate optics (e.g. microscope). Vibrational spectrometric methods provide information about the molecular structure of the investigated sample. In Raman spectrometry, this information is obtained by illuminating the sample with laser light and collecting the back scattered photons. Such photons with altered wavelength contain the required structural information. Raman spectrometry is highly selective: the spectrum enables unambiguous identification of molecules – just like a fingerprint. Spectra can be used to identify components in the sample, but they carry information about solid state characteristics (e.g. polymorphism) and enable quantitative analysis as well.
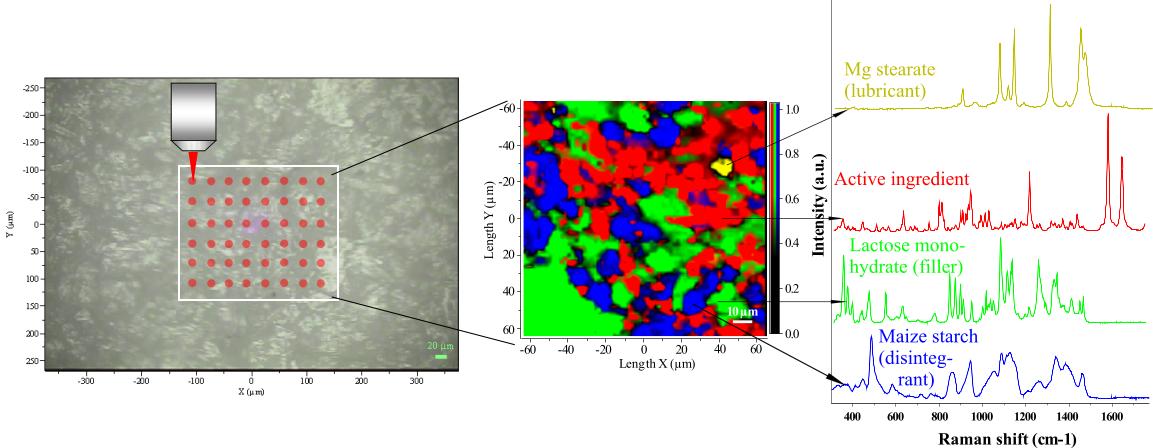
Figure 1. Principles and realization
of chemical imaging. The spatial distribution of various constituents can be
visualized via point-by-point mapping of the surface of interest followed by
adequate mathematical evaluation.
The excitation light can be focused on a very
small area (up to ~0.7 micron in diameter) using a microscope objective with
suitable magnification. Hence, chemical information can be obtained from
micrometer-scale regions of the sample. When chemical imaging is performed, a
user-defined area is scanned by point-by-point spectrum acquisitions. This
set of mapping spectra compose the chemical image, which can then be processed to
reveal the spatial distribution of the components of the sample.
Chemical images contain an enormous amount of
data. Although they can be evaluated via traditional spectrometric approaches,
e.g. plotting the intensity at a selected wavelength against the spatial
coordinates, the huge amount of data can be much better explored using adequate
mathematical methods (called multivariate data analysis or chemometrics). Scientific
achievements in this area have significant importance in medicine, environment-friendly waste
management and recycling and in handling the growing
problem of pharmaceutical counterfeiting. This area is described in detail in two of our review
papers [I,II]. (These reviews are in Hungarian language. Comprehensive
introduction in English can be found in References [6] and [7].)
The research goal, open questions
The primary scope of my research work was to improve the efficiency of chemical imaging methods by implementing adequate mathematical evaluation and identify new potential applications that open up thereby. All analyses in this work were related to technological development projects pursued in our research group, and were thus performed in the frame of industrial or international projects. Multiple questions were to be answered in multiple areas.
(1) Various technologies are available for manufacturing pharmaceuticals. We wanted to determine whether the visualization and statistical analysis of the spatial distribution of components can improve our understanding of the differences between the various manufacturing methods (and the products prepared).
(2) Crystalline impurities in amorphous active
ingredients can greatly deteriorate their dissolution in the stomach and thus
their biological efficiency. Current widely used methods can reliably
detect crystallinity only above approx. 5% crystalline content. We aimed to
greatly increase sensitivity by using Raman mapping. This way, crystal nuclei
can be detected early and stability/shelf life of the products can be estimated
already at the time of manufacture.
(3) A relevant question in both industry and forensics is the characterization of samples containing unknown components (such as illegal drugs, counterfeit pharmaceutical products and industrial products containing unknown impurities due to defects in technology). Unknown components are to be identified, quantified, and their spatial distributions revealed.
(4) An important environmental issue is the
determination of the recyclability of industrial (e.g. automotive, construction
and electrical) waste. Recyclability can depend on major components, trace
contaminants and degraded parts. Currently there is no truly efficient method
for automated, non-invasive analysis of such samples. Hence, we applied Raman
mapping in the automated characterization and quantification of industrial
polymer waste (the constituents of which were not known beforehand) to aid the
recycling process.
Methodology
|
|
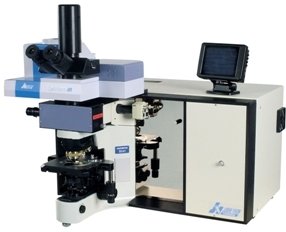
All investigations were carried out with a LabRam type
Raman-microscope (Horiba
Jobin Yvon) (with the exception of the reference studies in each
corresponding scientific area). Details and parameters can be found in our
publications [II-XIV]. The sample is illuminated by a (selected) laser source, the beam of
which is focused onto the desired spot with a microscope objective of
selected magnification. Using an appropriate laser source and optional
intensity filters make all of the analyses completely
non-invasive. |
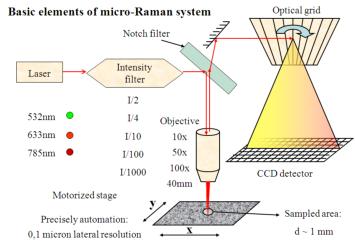 Figure 3: Schematic draft of micro-Raman system |
Back-scattered radiation is collected by the same
objective. Rayleigh photons
(backscattered with unaltered energy/wavelength) are removed with a notch
filter, leaving only Raman photons (with altered energy/wavelength) in the beam.
The light is then directed through a mirror system, a confocal hole and an
entrance slit onto an optical grid which disperses the light before it reaches
the CCD detector.
|
Chemical images have a three-dimensional data structure owing to their
specific acquisition method. Such enormous data sets can be processed with
various mathematical methods (which are reviewed in detail in our paper
[II]). The most common approach is the selection of a suitable vibrational
band, the intensity of which is plotted against the spatial coordinates to
reveal the spatial distribution of components represented by the selected
peak. This approach, however, does not fully utilize the huge amount of data available. Practical issues to be considered are as follows: I. There are numerous substances without a truly selective
vibrational band that can be chosen to distinctively characterize their
distribution (see issues (1) and (2) described earlier.) II. When products with unknown components are characterized,
vibrational bands cannot be assigned to the various constituents (see issue (3)). III. Even after an adequate, thorough spectral
preprocessing, the intensities of vibrational bands may be influenced by noise
and other disturbing factors, so that any characterization based on single bands may
lead to completely misleading results (see issue (4)). |
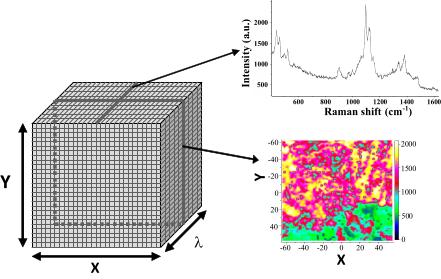 Figure 4. 3-dimensional data structure of
chemical images. The planes of X,Y coordinates are corresponding to
intensity distribution images at a certain wavelength, while lines in the
Z direction contain the measured spectra at a selected measured point
(pixel). |
Each analysis in our research was carried out by testing multiple algorithms and selecting the best one that provided maximum amount of information at highest accuracy.
Results
(1) Technological characterization of pharmaceutical products
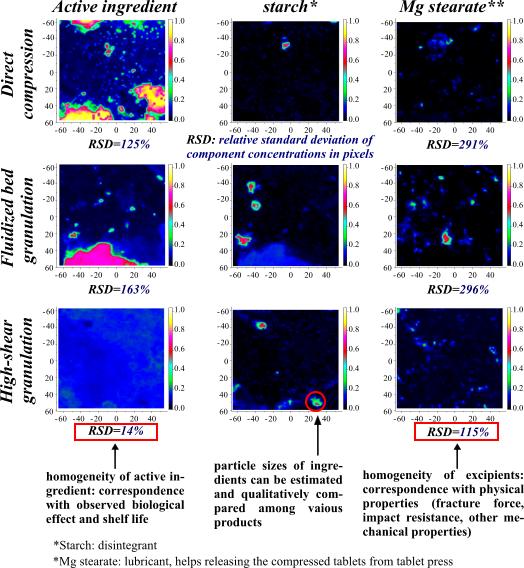 Figure 5. Visualized Raman maps of tablets manufactured with different preparation methods. |
Raman spectra acquired during chemical imaging can be modelled as the
weighted average of the Raman spectra of the pure ingredients (provided
that there are no interactions among them). This enables the estimation of
the concentration of each component for every measured pixel. The
mathematical distribution of the pixel concentrations contain a
significant amount of information about the macroscopic properties of the
products [IV-VII] Model tablets were prepared with seven different manufacturing
technologies, then the differences between these tablets were interpreted
based on the spatial distribution maps of the various components [V]. It was revealed that in possession of certain pieces
of previous information the concentration of all components can be
estimated rather accurately. This approach was used in the case of several products developed in our
research group, where the aim was to finely disperse the active ingredient
in the excipient (polymer) matrix to increase stability [IV, VI, VII]. |
(2) Early detection of crystallization in
amorphous (glass-state) materials
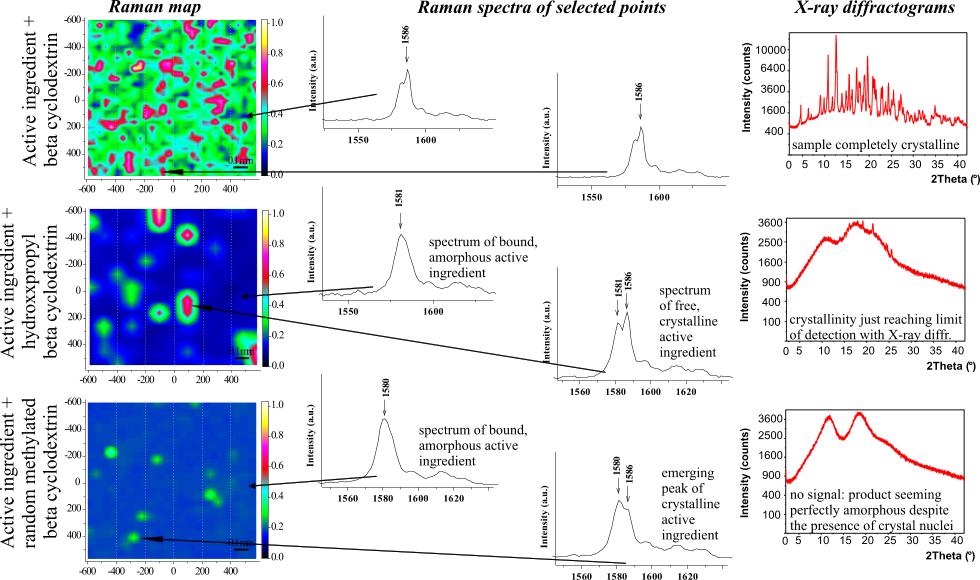 |
Many of the recently developed drugs have extremely poor solubility in the intestinal fluids. One possible solution is manufacturing the drug in amorphous instead of crystalline form, which, however, has to be stabilized. Stabilization can be done by adding excipients that interact with the active ingredients and by using adequate manufacturing technology [III, IV, VI, VII]. Analysis methods of high sensitivity are required for effective fine
tuning of the technological parameters. Using Raman mapping and
multivariate curve resolution algorithms, a new technique with very
high sensitivity was developed for the early detection and quantification
of crystal nuclei [VIII]. |
(3) Characterization of pharmaceutical products with unknown components
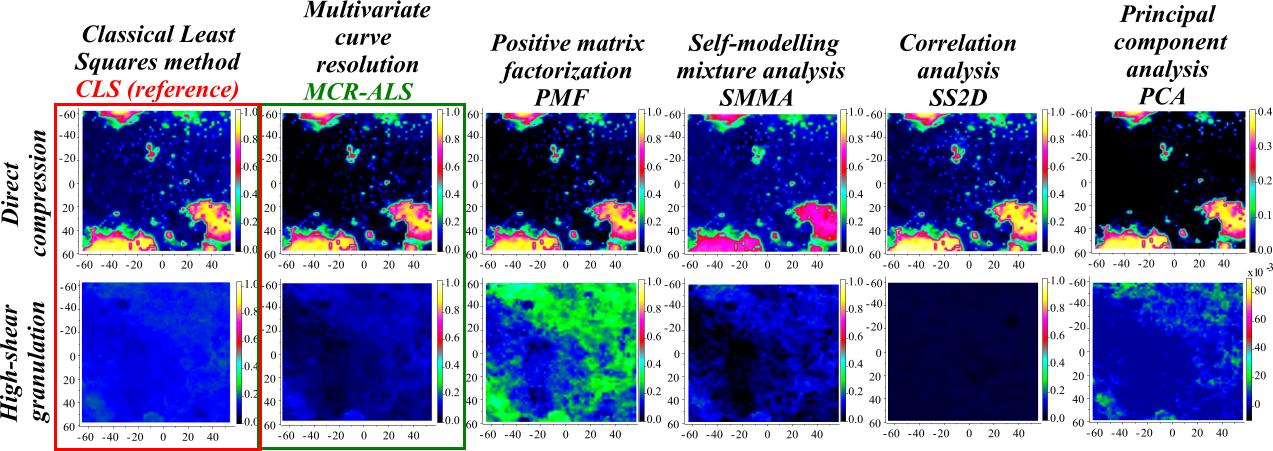 Figure 7. Distribution maps of the active
ingredient in two tablets prepared with different manufacturing
technologies, resolved without using any a priori information about
the tablets (as if they were completely unknown). MCR-ALS (green) algorithm resolved the
distribution of all ingredients with almost the same accuracy as if all
components were known and their true reference spectra were used for the
modelling (CLS,
red). The method is non-invasive, hence the tablets can be investigated
further with other techniques. This may play an important role in the
analysis of illegal products. |
Counterfeits, illegal drugs and industrial products containing
impurities are cases where the composition of the samples is unknown.
However, the huge amount of data stored in Raman images enable efficient
estimation of the pure component spectra (even though there are only
mixture spectra in the pixels). Thus, components can be identified and
their concentration and spatial distribution can be estimated [IX-XII]. |
Based on the spatial distribution of the ingredients, important conclusions can be drawn regarding the applied manufacturing technology of the product as well. This makes it possible to determine if two narcotic tablets have been prepared with the same method. This technique allows unambiguous distinction between 'high quality counterfeits' and original products, which currently cannot be reliably carried out with any other method. ('High quality products' can be just as dangerous to patients due to the fact that their manufacturers do not comply with the very strict regulations regarding the manufacturing of pharmaceuticals.)
4) Automated characterization of polymer waste

Figure 8. Automated quantitative analysis of polymer waste
Certain multivariate data analysis methods are capable of recognizing (classifying) the Raman spectra. We have recently developed a new method, using multivariate curve resolution algorithms, that do not require knowing the number and identity of the components in the waste sample [XIII]. Despite the extremely low quality of the Raman spectra collected from the waste materials, both major and trace components could be quantified with acceptable error rates [XIII, XIV]. This analytical method was then applied to different types of industrial polymer waste separated into density fractions via magnetic density separation [11]. Based on our Raman mapping results, we could define density intervals so that the separated raw material may be used for high quality recycled products (sample products have been prepared at BUTE Department of Polymer Engineering).
Expected impact and further research
Our group conducts research in the frame
of targeted international R&D projects and in close collaboration with industrial
partners. Our work is also connected to the BUTE Research University
program. We are currently collaborating with three Hungarian and two foreign
pharmaceutical companies that utilize our methods and results. Results shown
here have been published in seven peer-reviewed international and three
Hungarian journals. Furthermore, four of our articles are under review at
present.
Our work will most likely continue in three main
directions. A method is being developed for simultaneous, accurate
quantification (with known
error levels) of all components within a pharmaceutical product. Research will be continued in the area of unknown samples as
well. Furthermore, preliminary studies are being carried out, in collaboration
with the Chemical Research Center in Budapest, for the
application of the highly sensitive SERS
method in Raman mapping.
Publications, references, links
I. B. Vajna, Zs. Nagy, G. Patyi, Zs. Zsolt, I. Antal, Gy. Marosi. Application of chemical imaging in pharmaceutical technology. Acta Pharmaceutica Hungarica, 79, 104–116 (2009).
II. B. Vajna, P. Szepesváry, Gy. Keglevich, Gy. Marosi. Acquisition methods of chemical images and their evaluation with chemometric methods. Hungarian Journal of Chemistry, 116, 77–85 (2010).
III. G. Patyi, A. Bódis, I. Antal, B. Vajna, Zs. Nagy, Gy. Marosi. Thermal and spectroscopic analysis of inclusion complex of spironolactone prepared by evaporation and hot melt methods. Journal of Thermal Analysis and Calorimetry, 102, 349–355 (2010).
IV. Zs. Nagy, M. Sauceau, E. Rodier, B. Vajna, K. Nyúl, Gy. Marosi, J. Fages, Use of Supercritical CO2 aided and Conventional Melt Extrusion for Enhancing the Dissolution Rate of an Active Pharmaceutical Ingredient. Polymers for Advanced Technologies, to be published, DOI: 10.1002/pat.1991 (2011).
V. B. Vajna, I. Farkas, A. Szabó, Zs. Zsigmond, Gy. Marosi. Raman microscopic evaluation of technology dependent structural differences in tablets containing imipramine model drug. Journal of Pharmaceutical and Biomedical Analysis, 51, 30–38 (2010).
VI. Zs. Nagy, A. Balogh, B. Vajna,
A. Farkas, G. Patyi, Gy. Marosi. Comparison of electrospun and extruded,
Soluplus(R) based solid dosage forms of improved dissolution. Journal
of Pharmaceutical Sciences, submitted (2011)
VII. G. Patyi, T. Horváthová, A. Marosi,
B. Vajna, A. Bódis, I. Antal, Zs. Nagy, Gy. Marosi. Complex of
Spironolactone and Hydroxypropyl-β-Cyclodextrin Prepared in Twin-screw Extruder
and Used for Enhancing Dissolution Rate. submitted (2011)
VIII. B. Vajna, I. Farkas, A. Farkas, H. Pataki, Zs. Nagy, J. Madarász, Gy. Marosi. Characterization of drug-cyclodextrin formulations using Raman mapping and multivariate curve resolution. Journal of Pharmaceutical and Biomedical Analysis, in press, DOI: 10.1016/j.jpba.2011.05.005 (2011).
IX. B. Vajna, G. Patyi, Zs. Nagy, A. Farkas, Gy. Marosi. Comparison of chemometric methods in the analysis of pharmaceuticals with hyperspectral Raman imaging. Journal of Raman Spectroscopy, in press, DOI: 10.1002/jrs.2943 (2011).
X. B. Vajna, A. Bódis, Gy. Marosi. Multivariate data analysis in chemical imaging. Journal of the Hungarian Chemical Society, year 65, issue 10, 313–319 (2010).
XI. B. Vajna, A. Farkas, H. Pataki,
Zs. Zsigmond, T. Igricz, Gy. Marosi. Testing the performance of pure spectrum
resolution from Raman hyperspectral images of differently manufactured
pharmaceutical tablets. Analytica Chimica Acta, submitted
(2011).
XII. B. Vajna, H. Pataki, Zs. Nagy,
I. Farkas, Gy. Marosi. Characterization of melt extruded and conventional
Isoptin formulations using Raman chemical imaging and chemometrics. International Journal of
Pharmaceutics, submitted (2011).
XIII. B. Vajna, B. Bodzay, A.
Toldy, I. Farkas, T. Igricz, Gy. Marosi. Analysis of car shredder polymer waste
with Raman mapping and chemometrics. Waste Management, submitted
(2011).
XIV. B. Vajna, K. Palásti, B.
Bodzay, A. Toldy, S. Patachia, R. Buican, C. Catalin, M. Tierean. Complex
analysis of car shredder light fraction. The
Open Waste Management Journal, 3, 47–56 (2010).
[1] S Nakashima. Raman imaging of semiconductor materials: characterization of static and dynamic properties. Journal of Physics: Condensed Matter, 16, S25-S37 (2004).
[2] Y. Zhang, H. Hong, W. Cai. Imaging with Raman spectroscopy. Current Pharmaceutical Biotechnology 11, 654–661 (2010).
[3] P. Tatzer, M. Wolf, T. Panner. Industrial application for in-line material sorting using hyperspectral imaging in the NIR range. Real-Time Imaging 11, 99–107 (2005).
[4] A. Gowen, M. Taghizadeh, C.P. O'Donnell. Identification of mushrooms subjected to freeze damage using hyperspectral imaging. Journal of Food Engineering, 93, 7-12 (2009).
[5] T. Furukawa, H. Sato, Y. Kita, K. Matsukawa, H. Yamaguchi, S. Ochiai, H.W. Siesler, Y. Ozaki. Molecular structure, crystallinity and morphology of polyethylene/polypropylene blends studied by Raman mapping, scanning electron microscopy, wide angle X-ray diffraction, and differential scanning calorimetry. Polymer Journal 38, 1127–1136 (2006).
[6] A.A. Gowen, C.P. O’Donnell, P.J. Cullen,
S.E.J. Bell. Recent applications of Chemical Imaging to pharmaceutical
process monitoring and quality control. European Journal of
Pharmaceutics and Biopharmaceutics 69, 10–22 (2008).
[7] C. Gendrin, Y.
Roggo, C. Collet. Pharmaceutical applications of vibrational chemical imaging
and chemometrics: A review. Journal of Pharmaceutical
and Biomedical Analysis, 48 533–553 (2008).
[8] A. Toldy, N. Tóth, P. Anna, Gy. Keglevich, K.
Kiss, Gy. Marosi. Flame retardancy of epoxy resin with phosphorus-containing
reactive amine and clay minerals. Polymers for Advanced Technologies,
17, 778–781 (2006).
[9] B. Bodzay, B.B. Marosfői, T. Igricz, K. Bocz,
Gy. Marosi. Polymer Degradation Studies Using Laser Pyrolysis-FT-IR
Microanalysis. Journal of Analytical and
Applied Pyrolysis, 85, 313–320 (2009).
[10] Sz. Matkó, I. Répási, A. Szabó, B. Bodzay, P. Anna, Gy. Marosi. Fire retardancy and environmental assessment of rubbery blends of recycled polymers. Express Polymer Letters, 2, 126–132 (2008).
[11] E.J. Bakker, P.C. Rem. Upgrading mixed
polyolefin waste with magnetic density separation. Waste management, 29,
1712–1717 (2009).
Technology of Pharmaceutical, Environmental and Safety Materials Research Group
Department of Organic Chemistry and Technology
equipment of our research group
Chemometrics (multivariate data
analysis)
Attenuated
Total Reflectance (ATR)
Horiba
Jobin Yvon (manufacturer of our LabRam type micro-Raman
spectrometer)