|
|
BMe Research Grant |
|

Sinkovics Bálint
BMe Research Grant - 2022
![]()
Doctoral School of Electrical Engineering
BME-VIK, Department of Electric Power Engineering
Supervisor: Dr. Hartmann Bálint
Development of a photovoltaic power forecast on the regional level
Introducing the research area
The last decade has seen a dynamic growth of photovoltaic power generation to meet Europe's energy decarbonization targets. However, the technology's weather-dependent, volatile generation behavior creates many challenges for grid operators. This research aims to forecast the production of small-scale solar PV units without real-time measurements at the regional level.
Brief introduction of the research place
The MTA-BME FASTER Lendület Research Group, led by Dr. Bálint Hartmann, aims to increase the observability of the extensive, low instrumentation low-voltage power grid. The focus of the research is on the development of algorithms and procedures that can detect abnormal events (e.g. local outages), increase the flexibility of the grid operation, and prepare it for emerging disruptive technologies (e.g. e-mobility).
History and context of the research
The domestic and international share of photovoltaic power generation is currently on a dynamic upward trend. Small-scale residential entities are typically installed on rooftops and public buildings and connected to the low-voltage distribution grid without geographical concentration. By the end of 2021, the number of small-scale residential-scale PV systems will reach 90,000 units with a nominal installed capacity of 1,400 MWp.
Approximately 60,000 to 65,000 medium/low voltage transformer circuits supply the 4.1 million households in the country, and the huge size of the system means that its instrumentation is very low. So far, the lack of real-time metering information has not been a problem, given the predictable consumption, which can be well estimated by statistical methods.
However, with the advent of small-scale household-scale power plants, the number of possible system states is increasing, i.e. the local voltage conditions and the direction of power flows are no longer so easy to determine. Solar generation makes it difficult to maintain optimal operation and can increase the voltage beyond the standard range when power flows are reversed. To solve this problem, current passive grid management needs to be replaced by an active intervention approach. The key is not only real-time measurement but also the most accurate forecasting of local, weather-dependent power generation. Given that these household-scale small power plants are also not equipped with time-series (regular remote reading) meters, modeling the generation they generate is a particularly pressing task given the domestic grid conditions.
The research goals, open questions
The energy production of solar panels is influenced by changes in environmental parameters, in particular global radiation. Its change during the day is determined on the one hand by the position of the Sun and the Earth, and by atmospheric changes (mainly cloud shifts) on the other. While the former can be accurately modeled, the latter exhibits stochastic behavior.
Fig. 1.: Composite radar of the Hungarian Meteorological Service (OMSZ) on 1st of November 2021
Due to the weather-dependent nature of solar PV production, the difficulty of creating a highly accurate forecasting model describing intraday production variations arises for two reasons:
1) rapid, volatile changes in production over time and
2) spatial localization of the environmental global radiation affecting the process.
Thus, one of the keys to accurate local production forecasting is to achieve the highest possible spatio-temporal resolution.
The research aims to explore the temporal-spatial correlations of the global irradiance parameter describing the variation of photovoltaic power generation with a strong correlation using geostatistical methods. In this context, I sought to answer the following questions:
● Which forecasting approach can provide a local estimate with the highest possible accuracy?
● What is the best possible forecast of the most accurate forecasting method? What are the statistical relationships between the global radiation patterns at a given distance?
● What effect does the direction and speed of the wind have on the speed of cloud drifts and the correlation between two measurement points?
● What is the critical minimum spatial distance within which it is still worthwhile to use the data of a measuring station for estimation? Which method should be used to consider data from several stations together?
Methods
The main limitation of today's widely used weather-dependent production estimation methods based on historical data (e.g. neural networks, time series, statistical models) is the lack of ability to describe production changes that do not fit into fast, daily trends. To be able to describe the temporal dynamics of these rapid events, it is necessary to measure and model the environmental parameters (e.g. cloud cover, global radiation) that influence them. The data from estimation models developed for this purpose (e.g. sky cameras) can typically only be used within a narrow geographical range.
Computing-intensive numerical weather prediction models describing changes in the Earth's atmosphere (e.g. WRF, AROME) are capable of estimating environmental parameters with high accuracy and spatial coverage, but their spatial granularity is only a few km2 and their temporal resolution is typically hourly.
Given that global irradiance, which describes photovoltaic production with a strong correlation relationship, is a spatially concentrated parameter, unlike temperature, for example, it is necessary to explore spatio-temporal dependencies. The importance of this aspect for the active grid operation mentioned above is even more appreciated since an accurate estimate must be given not only for a single site but for every single producer in a region. In other words, a solution with significantly higher spatial (and temporal) resolution is needed.
In light of the above, my research was aimed at increasing the spatio-temporal resolution of a dataset generated by a numerical global radiation prediction model. To do so, I first clustered the different solar types by cloudiness (cloudy, partly cloudy, clear sky) based on statistical relationships from historical global radiation measurement data. Then, for partly cloudy days, I determined how the correlation between two stations varies with time for a typical wind direction as a function of geographical distance. This step assumed that passing clouds appear in two measurements with a time delay proportional to the geographical distance. The results were plotted on a Hovmöller diagram.
Based on the obtained probability relations, I determined the critical geographical distance within which it is worthwhile to use the results of measurement data. Based on the results, I created a model that can determine the expected global radiation value for any geographic point using kriging based on the surrounding measurement data. The kriging determines a linear combination of nearby measurement data, where the weights of the linear combination depend on the relative positions of the measurement locations and indirectly on the value of the measurements. The resulting kriging model is used to refine the forecast data for an arbitrary geographic point, rather than those in the past.
Results
I used both historical and forecast data for the research. To refine the spatio-temporal resolution of the forecast, I examined the global radiation measurements of the National Meteorological Service in Pest County (see Figure 2).
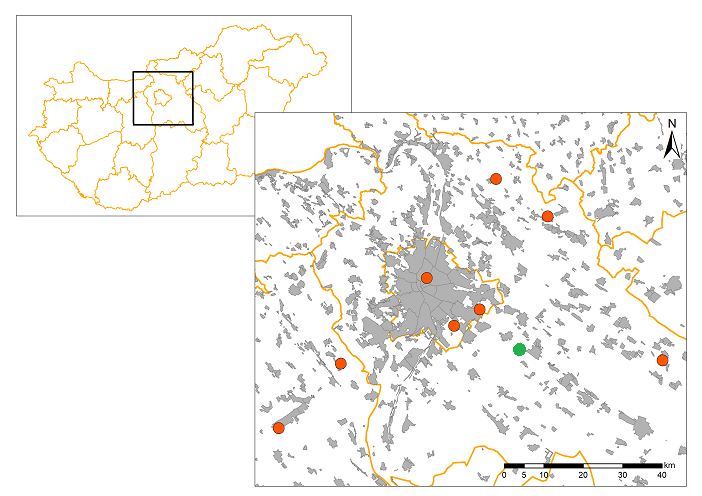
Figure 2: Location of the OMSZ meteorological stations used in the research (red) and the geographic position of one of the household-scale PV generators used for validation (green)
To prepare the production estimate, I used the following 3 main steps:
1. Exploration of identifiable time lags between the data from each measuring station as a function of distance
The available data recorded at eight measurement stations in Pest County are interrelated in time with a certain delay and significance. For a given wind direction, the correlation between the data of two stations located in the same line can be given by the speed of cloud passage. The aim is to determine the "strength" of this relationship as a function of distance, which is evaluated using a Hovmöller diagram. First of all, each day was categorized into 3 clusters: clear sky, partly cloudy, and cloudy days. The Hovmöller diagram clearly shows the differences. In each case, a 3-dimensional density function is shown "from above", where the y-axis represents the time delay between the two measuring stations, whereas the x-axis the distance between them. Thus, for two stations with an intermediate distance of 40 km, we find the evolution of the distribution between them as a function of the delay time at 40 km on the x-axis in each case. It can be observed that for clear sky days, the delay time is concentrated around 0 min regardless of the distance because there is no significant difference between the recorded measurements (no atmospheric "disturbance"). However, when considering the partly cloudy case, the dispersion of the distribution is already significantly larger (the distribution curve is "spreads out").
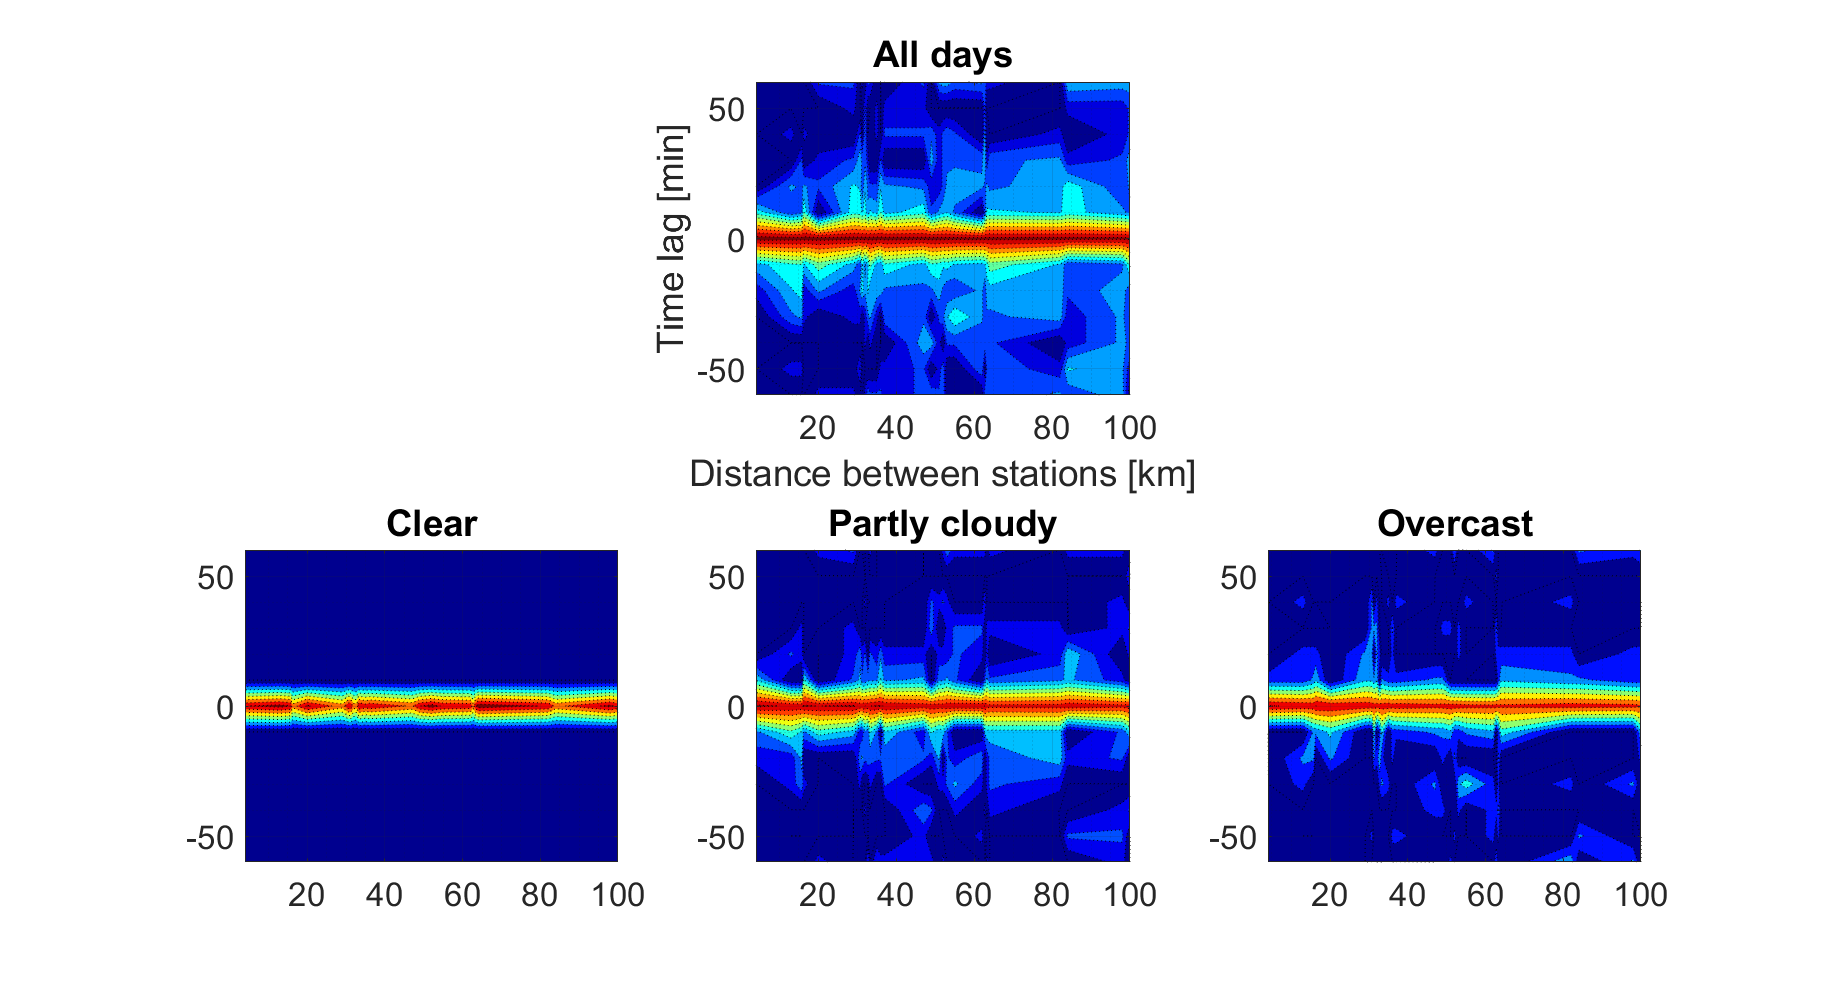
Figure 3: Hovmöller diagrams for days with different cloud cover (clear sky, partly cloudy, overcast - bottom row from left to right) and for the whole dataset (top middle)
2. Determination of critical geographical distance
The same Hovmöller diagram gives an illustrative picture of the relationships between station measurements. However, it is not necessary to use all measurement data to estimate the solar panel at a given geographic point. Therefore, the goal of the second step is to define a critical geographic radius within which the use of measurement points based on historical data is sufficiently correlated to be used effectively. So essentially the scatter of the distributions shown in the Hovmöller diagram is shown in Figure 4 for all measurement station pairings.
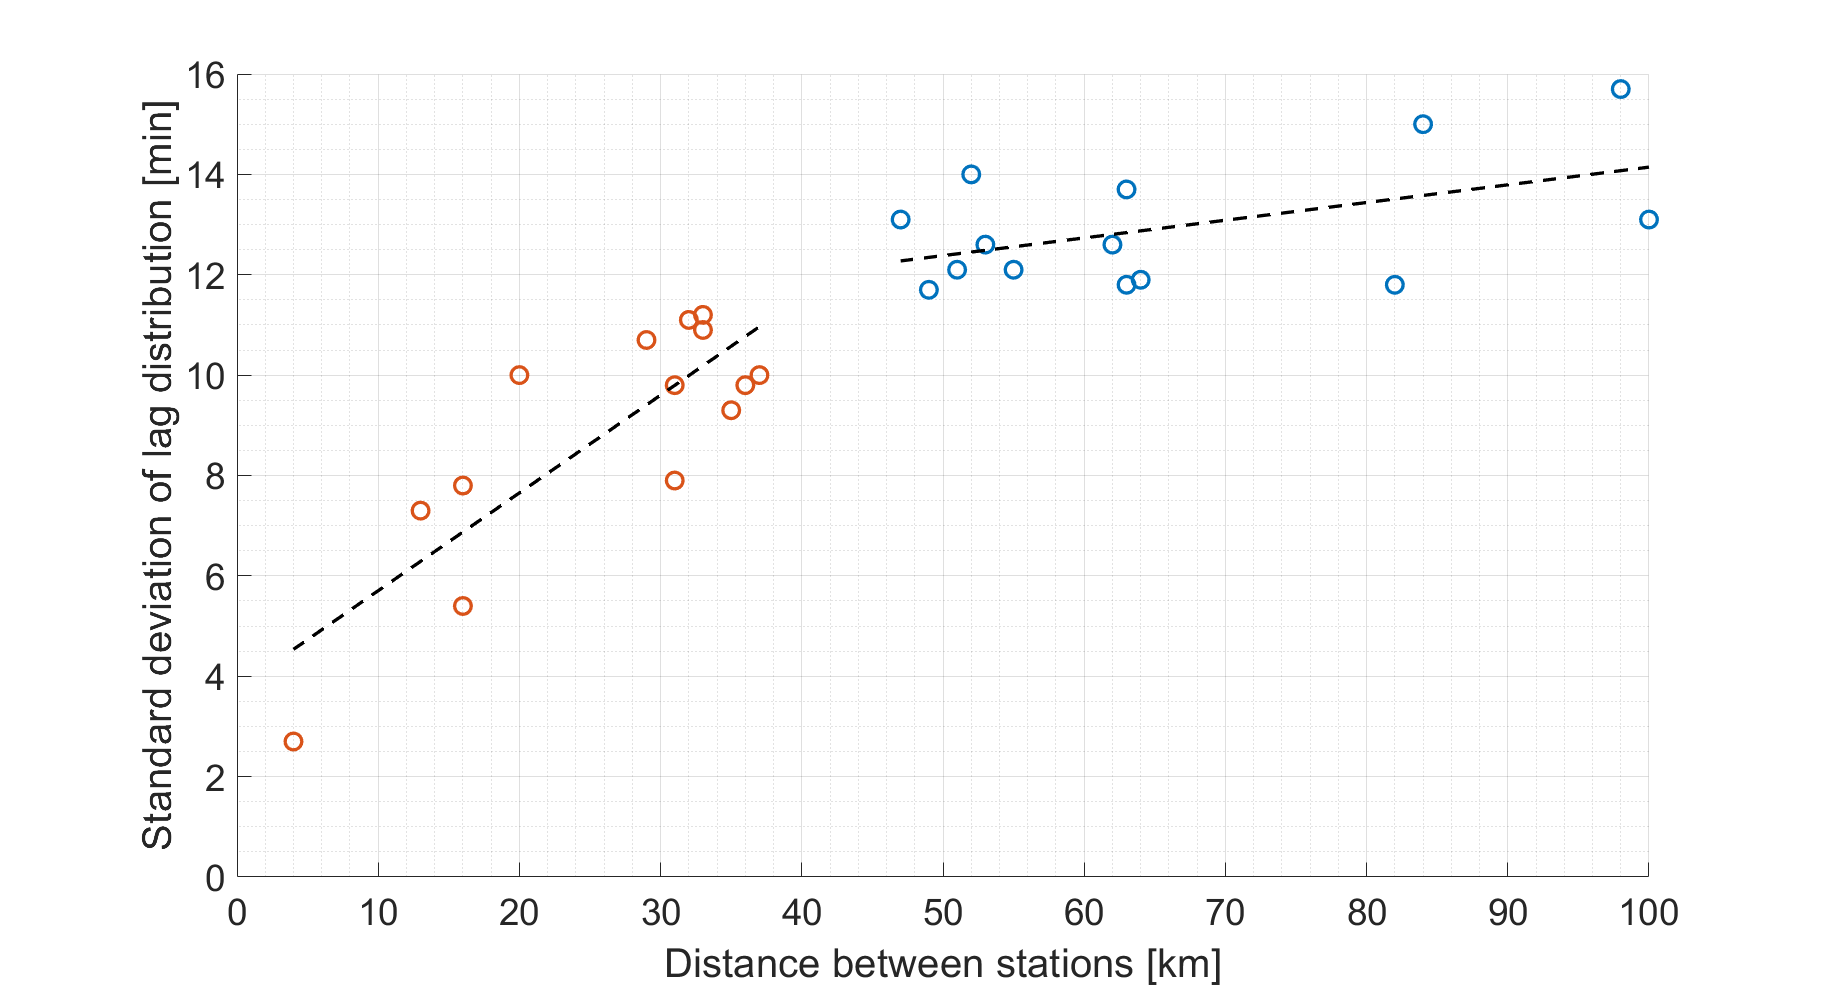
Figure 4: Variation of the dispersion of the time delay distribution curve by station pairs
Figure 4 already provides clear evidence that there is a clear break in the magnitude of the standard deviations as a function of station distances. Based on this, only data within a 20 km radius of each solar producer are used.
3. Link between past and future – using historical data results to increase the spatio-temporal resolution of forecasts
The statistical relationships obtained in the previous steps were used to refine the global irradiance estimate produced by the numerical forecast. The prediction model defines values at the corners of a grid (red points), while the producer under study is located at the green point in Figure 5. For this geographic point, kriging is used to determine the expected global radiation magnitude using a linear combination of the estimated values within a 20km radius of the nearby point. This global irradiance value is finally converted to real production using a virtual solar model.
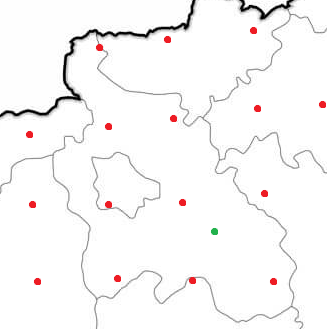
Figure 5: Illustration of numerical weather model results (red) and the position of one of the photovoltaic generators used for validation
I validated the results of the presented model with 2 months of production data from a specific small solar power plant. The presented model is simultaneously able to consider the effects of extreme cloud shifts (which most estimators are unable to do due to lack of information) and, using kriging, it is also suitable for estimation at any geographical point, i.e. for providing a regional level estimation. Based on the run results so far, the accuracy of the model significantly exceeds the accuracy of the reference forecasting models (Neural Network, ARIMA, and Persistence model).
Expected impact and further research
The novelty of the model developed lies in its flexibility of use. The production estimation models in the literature are typically validated based on data from a few geographical points. In our case, this also happened to the additional producer available in the region. A further objective is to extend the results to a national scale and to forecast household-scale solar PV production without time-series (real-time) measurement on a regional scale. The results will also allow the modeling of critical low-voltage grid sections without metering data. Using the results, I aim to create an alternative to the necessary but very costly grid upgrading and thus facilitate the integration of renewable energy sources into the grid.
The paper summarizing the results has been submitted to an impact factor journal and presented in an accessible form at the Hungarian Science Festival of the Hungarian Academy of Sciences, the MEE Vándorgyűlés (Annual Conference) events, which are well-known to the wider profession, and in the Life and Science columns.
Publications, references, links
List of corresponding own publications.
Journal publications
B. Sinkovics: A napelemek termelésének előrejelzése a múlt és a jelen tükrében, Élet és Tudomány, 25, (2022)
I. Táczi, B. Sinkovics, I. Vokony, B. Hartmann: The Challenges of Low Voltage Distribution System State Estimation – An Application Oriented Review. Energies (2021), 14, 5363
B. Sinkovics, J. Kiss, B. Polgári, J. Csatár: Co‐simulation framework for calculating balancing energy needs of a microgrid with renewable energy penetration, International Journal of Energy Research, pp. 18631–18643, vol. 45 (2021)
B. Sinkovics, B. Hartmann: Analysing Effect of Solar Photovoltaic Production on Load Curves and their Forecasting, Renewable Energy and Power Quality Journal, pp. 760–765. , 6 p. (2018)
B. Sinkovics, I. Táczi, I. Vokony, B. Hartmann: A novel adaptive day-ahead load forecast method, incorporating non-metered distributed generation: a comparison of selected European countries, Mathematical Modelling of Contemporary Electricity Markets (MMCEM), pp. 62–81, Chapter 3, Elsevier (2020)
B. Hartmann, A. Kazsoki, V. Sugár, B. Sinkovics: Napsugárzás-mintázat kategorizálási módszereinek kritikai szemléletű összehasonlítása, Magyar Energetika pp. 18–24., (2020)
B. Sinkovics: Fogyasztás és termelés egyensúlya: A jövő megoldása az energiaéhségre? Élet és Tudomány, pp. 233–235, (2019)
Conference publications
B. Sinkovics: Fotovillamos termelésbecslő modell bemutatása térbeli-időbeli krigelés alkalmazásával, MEE Vándorgyűlés (2021)
I. Táczi, B. Sinkovics, I. Vokony, B. Hartmann: Conceptual Analysis of Distribution System State Estimation of Low Voltage Networks, International Conference on Renewable Energy and Power Quality (ICREPQ 2020)
B. Sinkovics: Computer-Based Algorithm to Predict the Change in Daily Electricity Demand, Advanced ICT Tools and Methods for Cyber-Physical Systems and Biomedical Applications, Esztergom, Hungary (2019)
B. Sinkovics, B. Hartmann: Analysing Effect of Solar Photovoltaic Production on Load Curves and their Forecasting, International Conference on Renewable Energy and Power Quality: ICREPQ'18 Vigo, Spain: Europe-an Association for the Development of Renewable Energies, Environment and Power Quality (EA4EPQ), pp. 1–6. (2018)
Table of links.
https://hartmannbalint.wixsite.com/faster
List of references.
D. Yang, Z. Dong, T. Reindl, P. Jirutitijaroen, W. M. Walsh, Solar irradiance forecasting using spatio-temporal empirical kriging and vector autoregressive models with parameter shrinkage, Solar Energy, vol. 103, pp. 550–562, 2014
D. Yang, Z. Dong, A. Nobre, Y. S. Khoo, P. Jirutitijaroen, W. M. Walsh, Evaluation of transposition and decomposition models for converting global solar irradiance from tilted surface to horizontal in tropical regions, Solar Energy, vol. 97, pp. 369–387, 2013