|
|
BMe Research Grant |
|

Gergely László Zsolt
BMe Research Grant - 2023
![]()
Géza Pattantyús-Ábrahám Doctoral School of Mechanical Engineering
BME ÉPGET
Supervisor: Dr. Csoknyai Tamás
Research on net zero energy and carbon neutral buildings
Introducing the research area
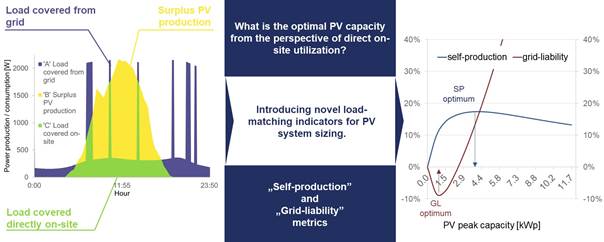
The focus of the research is on the modern and efficient energy supply of residential buildings. As this is most commonly realized with both solar systems for electricity generation and heat pumps for heat generation, the research primarily focuses on the simultaneity of these appliances. It is well known that we use energy even when we do not have solar generation, and we can also generate energy with our solar systems when we do not have significant energy consumption ( Figure 1, Figure 2) [1].
Figure
1 .
The problem of simultaneity of solar generation and building energy use
illustrated in a schematic diagram
Brief introduction of the research place
The Energy in Buildings Research Group at the Budapest University of Technology and Economics has participated in several European and national research programs and has links with European research institutes and universities. Research interests include energy efficiency and renewable energy systems in buildings: near-zero and net-zero energy buildings, smart buildings and communities, consumer behavior analysis and modeling, dynamic building energy simulation, and building stock modeling.
History and context of the research
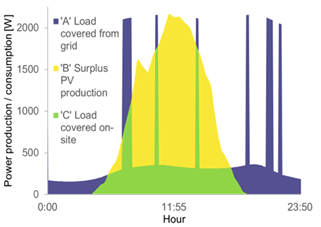
The role of our residential buildings in energy systems has changed significantly in recent years. The number of small-scale household power plants is now considerable, with an installed capacity of nearly 1,500 MW in our country. However, the sizing of solar PV systems is often based on economic rather than technical considerations. As a consequence, while we often develop a building system with 'net-zero energy' on an annual average – meaning that our solar production equals our (electricity) consumption on yearly basis – for the electricity grid, it also poses a challenge that we actively feed electricity back into the grid during certain periods, while in other periods, we draw electricity from it. The root of the problem is mainly the technical building system itself (which can be traced on the periodicity of photovoltaic power generation and the loads of a household in Figure 2), we can help provide a solution from the building services engineering perspective by exploring the potential of using as much energy generated directly on-site as possible. We can do this by developing passive measures, such as solar scaling frameworks, or by applying active solutions such as the integration of thermal storage, batteries, or even by demand side management [2].
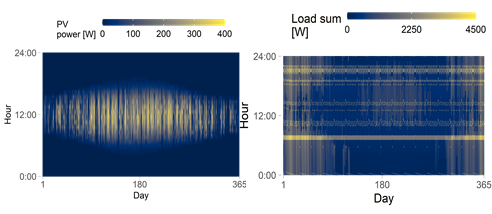
Figure
2.
PV generation (left) and building consumption performances throughout a year.
The research goals, open questions
The aim of the research so far has been to explore the problem itself and identify possible improvements. Among these, the question of
based on technical principles, how should the optimal installed capacity of household-scale household PV systems be chosen,
were answered by introducing the self-production and grid-liability indicator. However, further questions arise:
· How do the different systems behave under demand-side management?
· What is the potential of using heat pump systems in optimal periods, or on optimal load?
· To what extent can direct on-site PV utilization can be pushed?
· How do these affect the final-energy demand?
So, the resulting question are: What is the potential of the coordination of renewable energy systems of residential users? Furthermore, how can the legal and accounting framework support this, by phasing out net billing?
Methods
Since the problem lies in the temporality of systems (e.g., the change of ambient weather conditions), we have chosen a method and tool that allows us to explore a range of alternatives with high resolution of data along variable parameters. We use dynamic building energy performance simulation software (TRNSYS, DesignBuilder) to study the problem, allowing for the construction of physical models of systems. They also provide the possibility to investigate several building system options for a single building or compare the behavior of several building types with identical systems. It is worth mentioning that building simulation software can also be used for the modeling of the various patterns of consumer behavior.
In our approach, we consider elements of the domestic residential building stock and model heat pump and solar PV building systems for these cases, with standard consumer profiles. The simulation software also allows us to consider not only specific weather patterns, but also different climate zones or scenarios that might occur in expected global warming scenarios. As a result, we can identify the factors that have the highest impact on the simultaneity of system operation.
Results
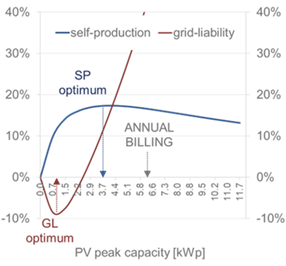
Figure 3.
Self-production and grid-liability as a function of different solar installed
capacities. The problem of scaling of
the balancing account.
Until now, no load matching indicators (metrics analyzing the simultaneity of production and consumption) have been available in the literature to provide a technical optimum for allocating the installed capacity of household-scale PV systems. The scaling of systems was therefore often motivated by the economic consideration that, with annual net metering, it was appropriate to install a solar system of a size that would produce as much electricity per annually as the household consumes per year.
In our research so far, we have recognized the problem and in response we have introduced two novel indicators, the grid-liability index and the self-production indicator, which, in contrast to the commonly used self-consumption and self-supply indicators, have an optimum as a function of the installed solar capacity [3,4].
"Grid-liability" defines the solar capacity for which we are most independent from the grid. It can therefore be used to show how the energy balance of our household and the electricity grid changes relative to a given solar capacity without solar PV. The indicator therefore considers the fact that in the case of oversized systems, we are feeding a large amount of electricity back to the grid, increasing the interaction with it. The range of the indicator is [0,∞), with an optimum of -1. From a PV capacity point of view, at a value of 0, the interaction with the grid is just as high as without a PV system. At a value of -1, the system is completely independent from the grid - it covers its energy consumption from its own PV system (and its storage) in any case. While the absence of an upper limit means that, in the case of oversizing of the system, it is futile to meet all your energy needs from your PV system if you are in the meantime feeding an extraordinary amount of energy back to the grid.
Following the notations in Figure 1. the indicator can be calculated as follows:
Our second indicator approaches the same set of problems from the electricity producer’s/consumer’s perspective. The "self-production" indicator is intended to reflect the share of energy used locally in relation to the total energy flow of the building (covered from grid + fed back to grid + direct on-site utilization). The range of the indicator is [0,1]. For a value of 0, there is no solar generation used locally, and for the optimum value of 1, all the energy generated is used locally and is just enough to meet the energy demand – meaning there is no feed back to the grid.
The indicator will improve as more of the installed solar capacity is spent on serving our own use directly.
Self-production can be described as:
We have also successfully shown that the indicators introduced can be usefully applied to the analysis of demand side management. In the case of system operation aligned with PV production, for example, storing surplus solar production as heat or domestic hot water, the values of the indicators are usually more favorable. In addition, based on our current results, the indicators can provide information on the most favorable solar installed capacity for the changed control as well.
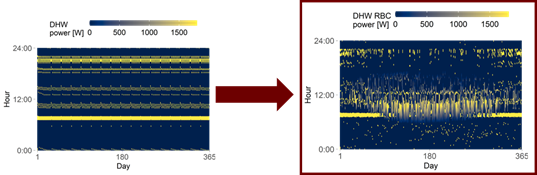
Figure
4.
Power demand for domestic hot water production with standard (left) and
improved (right) control logic.
Expected impact and further research
It is expected that the results will help in the deeper understanding of the set of problems, providing an opportunity for the development of new, more technically sound PV system sizing and accounting frameworks and offer possibilities for the sizing of solar systems that are most favorable for such frameworks. They will also help researchers to understand and evaluate the various system designs and control options in more depth.
The resonance of the research so far is well-reflected in the fact that the current results have been published in one of the most prominent journals in the field, the 11.446 impact factor Applied Energy [3].
References, including related publications
[1] L.Z. Gergely, Z. Szalay, T. Csoknyai, Nearly zero energy buildings with air-source heat pumps across Europe, in: 2022: pp. 1–7. https://doi.org/https://doi.org/10.34641/clima.2022.48.
[2] D. Fischer, H. Madani, On heat pumps in smart grids: a review, Renew. Sustain. Energy Rev. 70 (2017) 342-357. https://doi.org/10.1016/j.rser.2016.11.182.
[3] L.Z. Gergely, T. Csoknyai, M. Horváth, Novel load matching indicators for photovoltaic system sizing and evaluation, 327 (2022) 0–9. https://doi.org/10.1016/j.apenergy.2022.120123.
[4] L.Z. Gergely, T. Csoknyai, M. Horváth, Load transfer indicators for sizing a household scale solar PV system, Magy. (2022) 3–8.
Links to related research freely available
In Hungarian:
· http://www.epgeponline.hu/online_cikkek/reszletek/31
In English:
· https://www.sciencedirect.com/science/article/pii/S0306261922013800