|
|
BMe Research Grant |
|

SZAGRI Dóra
BMe Research Grant - 2023
IInd Prize
![]()
Pál Vásárhelyi Doctoral School of Civil Engineering and Earth Sciences
BME Faculty of Civil Engineering, Department of Construction Materials and Technologies
Supervisor: Dr. Szalay Zsuzsa
Vulnerability of Buildings to Summer Overheating
Introducing the research area
The vulnerability of buildings to summer overheating is an extremely relevant issue that requires attention not only from a comfort perspective but also in terms of health. The vulnerability of the population is influenced not only by health and socio-economic factors but also by the quality of our buildings since we spend a significant amount of our time indoors. In my research, I focus on the summer overheating and vulnerability of buildings. I investigate residential buildings using on-site monitoring measurements and dynamic whole-building simulations, and by using parameter sensitivity analysis, I determine the extent of overheating in different building types. These investigations can contribute to the development and promotion of positive building operation practices, strategies, and refurbishment in the future. They aim to make our existing building stock more comfortable and energy-efficient while identifying which building types require greater attention due to their susceptibility to summer overheating.
Brief introduction of the research place
I conduct my research under the supervision of Dr. Zsuzsa Szalay at the Department of Building Materials and Technologies at the Budapest University of Technology and Economics (BME), in collaboration with the ÉM-KÉK (Sustainable Energy and Climate Smart Building Research Group) research group. We participate in numerous domestic and international projects, working together to develop sustainable and environmentally friendly building solutions that effectively respond to the challenges of climate change. We carry out comprehensive building physics and building energy studies, considering the energy efficiency, thermal and moisture characteristics of buildings, as well as indoor comfort.
History and context of the research
Recently, we have heard a lot about climate change and related research. As shown in Figure 1, the warming stripes of Budapest show that the average annual temperatures have been increasing since the 2000s compared to the previous period.
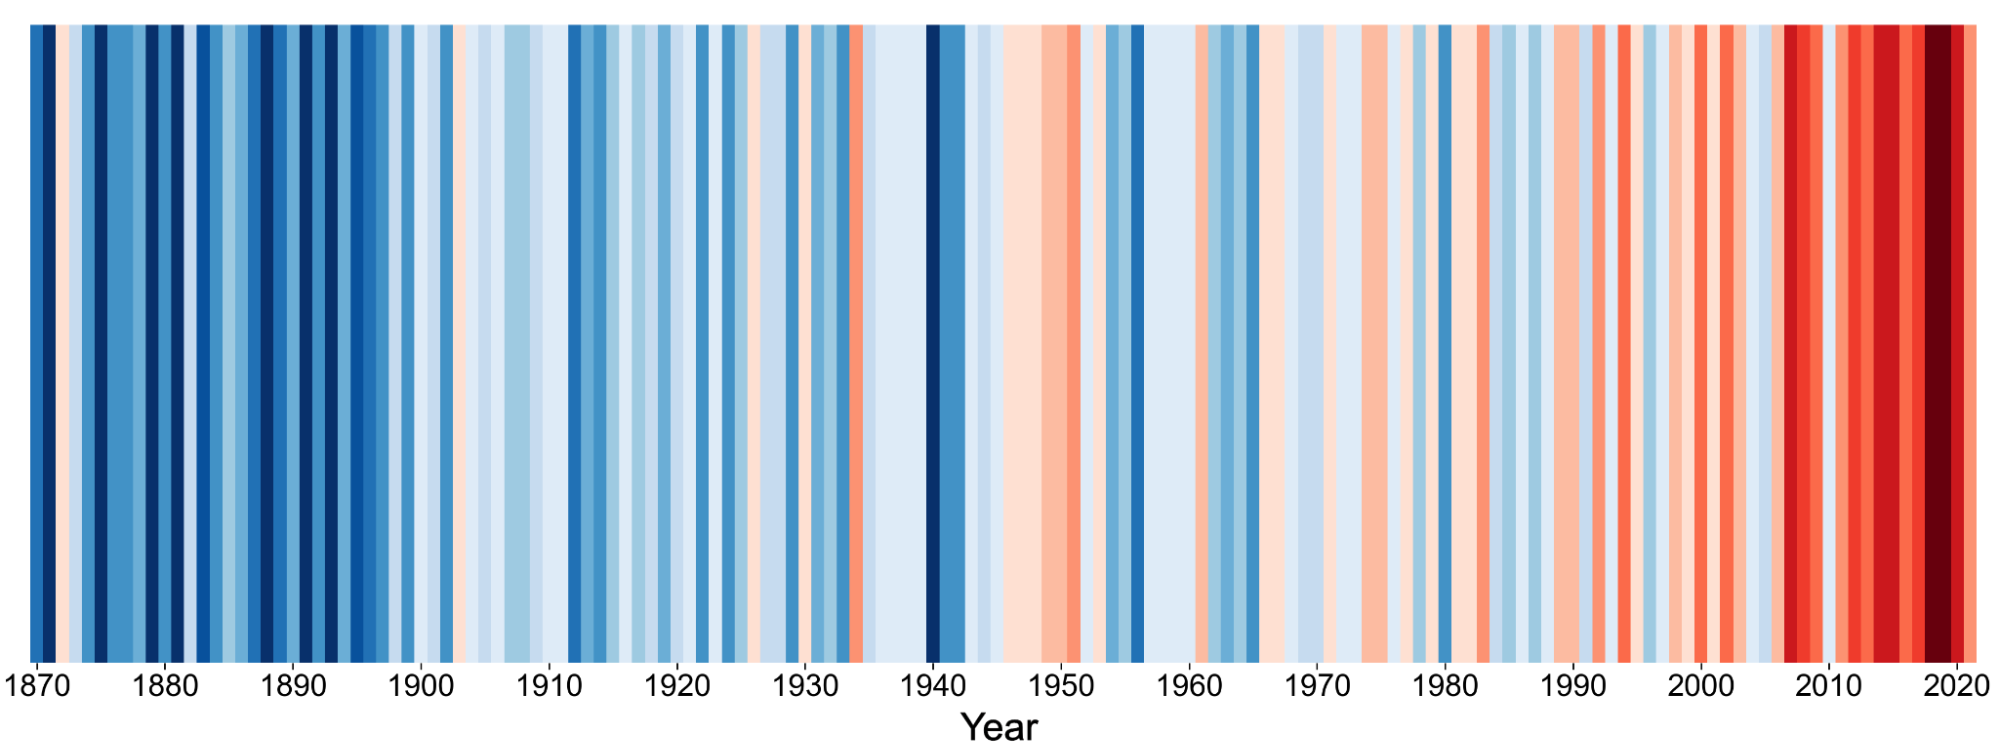
Figure 1 – Warming stripes of Budapest from 1870 (data source: OMSZ).
One of the consequences of this warming trend is the increase in the number and intensity of heat wave days [1, 2]. Numerous studies have demonstrated that higher external temperatures during the summer are associated with increased mortality and morbidity [3-5]. This raises the question of how our existing building stock can adapt to these changes [S1] and what passive strategies are available to enhance comfort [S2].
Previously, I explored this topic in the context of nursing homes [S3-S5], as the elderly population (aged 65+) is particularly vulnerable to heat waves. According to a questionnaire survey conducted among various homes, building overheating is a real issue that needs to be addressed. I used dynamic whole-building simulation to assess the buildings and determine the extent of overheating. I also observed that the value of the overheating index increased for insulated buildings, with a variable increase depending on the type and extent of insulation used. Increasing nighttime ventilation significantly contributed to reducing internal temperatures: with an air exchange rate of 4 ACH (air change per hour), a decrease of 36-54% was achieved, while with 6 ACH, the decrease ranged from 52-66%, depending on the building type. Continuing these investigations and expanding in terms of methodology and scale, I examine summer overheating in different residential buildings.
The research goals, open questions
Various methods are already available for assessing vulnerability to heat waves, such as the Heat Vulnerability Index (HVI) [S6] and vulnerability maps to help decision-makers identify the most sensitive areas to heat waves and develop adaptation plans. However, for truly effective mitigation, new approaches and enhanced methods are needed. HVI indices encompass a wide range of data and variables e.g., age, health condition, Urban Heat Island – UHI, Land Surface Temperature – LST, income. While some indicators are location-specific, others, such as building characteristics, have broader applicability but are currently less used variables in vulnerability assessments. In my research, I analyze vulnerability to heat waves and offer a new perspective and methodology for conducting such investigations. It is important to obtain a general picture of the attitude toward climate change and the state of the domestic building stock. By expanding the limited available measurement data, I examine the summer behavior and overheating in buildings, as well as the influence of various construction techniques and building operation practices on overheating. These measurement results are also used to perform dynamic whole-building simulations and validate the developed models. The dynamic whole-building simulations and models I perform allow for further investigations, such as analyzing refurbishment options and user habits. In addition to the measured buildings, the dynamic simulations are suitable for examining other building types and determining the key parameters that affect overheating through parameter sensitivity analyses.
Methods
The methodology and summary of the research are shown in Figure 2. A questionnaire survey was conducted to obtain a general overview of residents' opinions, experiences, and the state of the domestic building stock. Subsequently, on-site monitoring measurements were carried out for different building types [S7, S8], where sensor networks were installed in certain apartments and rooms. Prior to this, a 3D model of the interior layout of the apartments was created using LiDAR technology, which greatly facilitated the pre-assembly of the monitoring system.
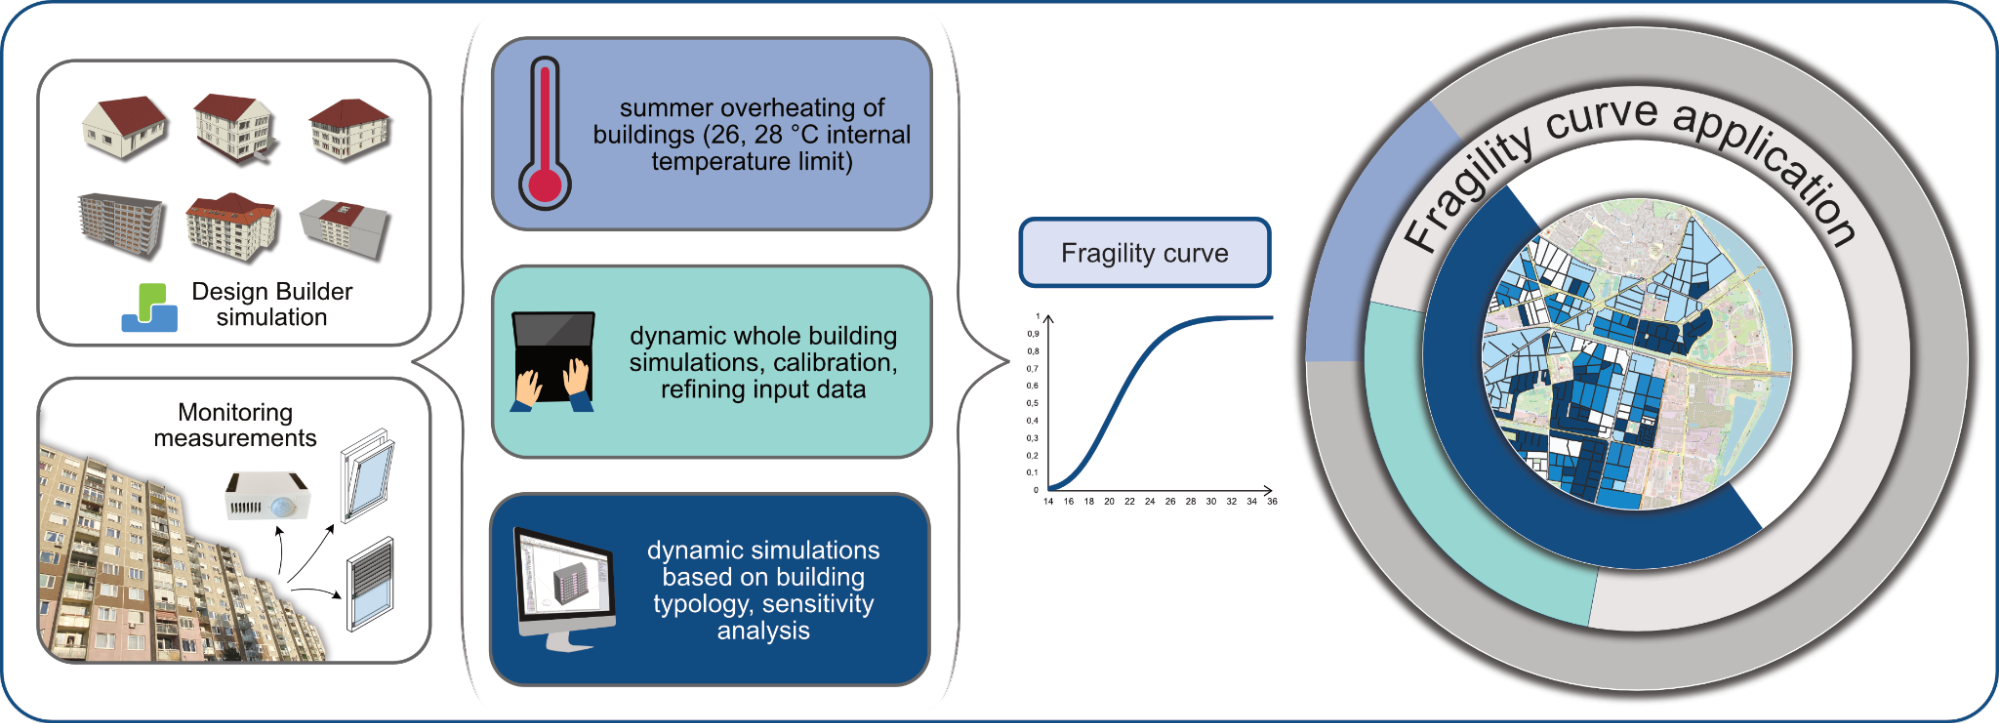
Figure 2 - main elements of the research.
The installed room sensors (Figure 3) are capable of recording air temperature, relative humidity, CO2 concentration, and occupancy. Additionally, user habits were monitored using window and blind modules. We recorded the position of the windows (closed, tilted, open) as well as the status of the blinds, which provided additional valuable data. During the evaluation, after data preprocessing, cleaning, and filtering, various statistical indicators were used to analyze and characterize the measured values, including the ODH26 indicator for describing overheating in the apartments. The ODH26 index (Overheating Degree Hours above 26 °C) represents the number of hours above 26 °C and indicates both the duration and magnitude of overheating (Kh - Kelvin × hours).
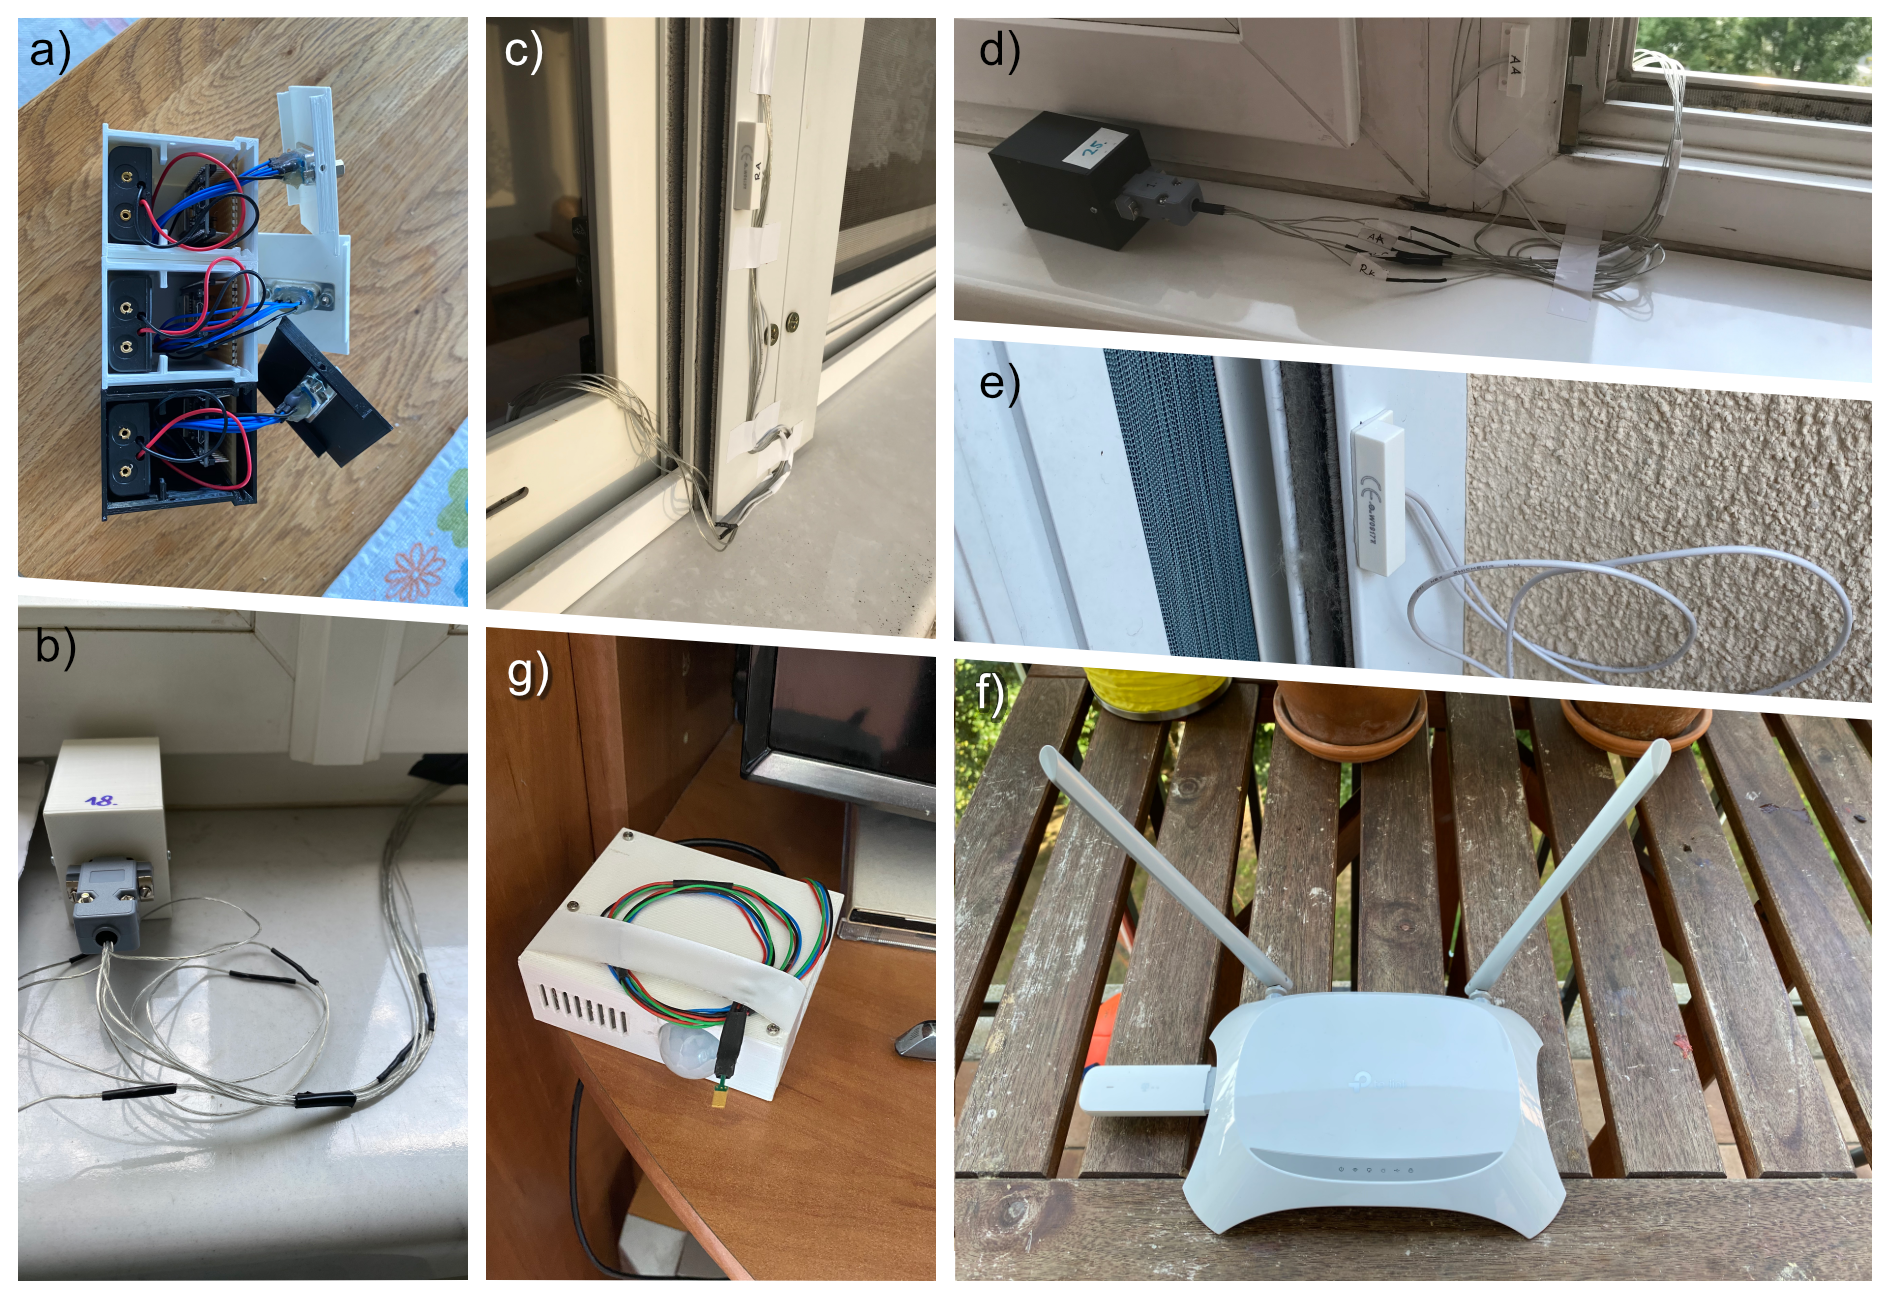
Figure 3 - monitoring system components: a) - e) window module, reed-switch, f) router g) room module.
We analyzed the measured apartments using a 3D dynamic whole-building simulation approach (video) with the Design Builder software, which utilizes the EnergyPlus calculation engine and is a validated tool based on the BESTEST [6]. Based on existing building typology, additional building types were included in the analysis.
Dynamic simulations can be used to investigate various aspects such as building refurbishment strategies, user behavior (favorable and unfavorable), the impact of future climate scenarios on the building, and parameter sensitivity analysis on specific buildings (e.g., the effect of insulation, orientation, shading, etc.). During the evaluation, it is possible to compare individual apartments, rooms, or entire buildings. After retrieving the results, the ODH26 indicator can also be calculated, and an overheating quantification test can be performed according to CIBSE TM52 [7], TM59 [8]. Additionally, fragility curves can be used to assess the probability that the internal daily average temperature will exceed a certain threshold (e.g., 26 °C, 28 °C) for a given daily external average temperature, under the same boundary conditions. It is important to analyze the buildings under various weather conditions to obtain a more objective comparison. Further analysis can involve exploring the sensitivity of parameters such as ventilation, internal loads, and shading through additional parameter sensitivity studies [S9]. Moreover, by using location-specific data, it is possible to create hazard curves based on statistical weather data, providing an objective assessment of the expected overheating in a building at a specific location.
Results
The analyzed buildings are located in different parts of Budapest (districts XI and XVIII), and the measurements were taken in the two buildings during different periods. In the case of the prefabricated concrete panel building in the Havanna residential area, it can be observed that the average temperature in every room reached 26°C throughout one entire summer month measured so far, and in the case of the two bedrooms, it even approached 28°C, which is significantly higher than the commonly used 26°C as a threshold of overheating. The ODH26 indicator values during this period were 1543 Kh in the kitchen, 1013 Kh in the living room, 1765 Kh in the small bedroom, and 1717 Kh in the large bedroom [S8]. If we examine this in more detail, we have the option to display the elements of the indicator on an hourly basis. Figure 4 shows the number of hours when the internal temperature in the rooms exceeded 26 °C. The color of the cells indicates the extent to which this threshold was exceeded. The image shows that overheating can even be a problem during nighttime hours if the external air temperature is not sufficiently low and the occupants are unable to ventilate the room effectively.
Figure 4 - hourly values of the ODH26 indicator in four measured rooms.
Long-term data also show that carbon dioxide (CO2) concentrations tend to be higher in residential spaces in autumn, winter, and spring. Particularly, the bedrooms had significantly high values, which can reach as high as 5,000-6,000 ppm during nighttime hours. It is important to note that CO2 concentrations above 1,500 ppm can have negative physiological effects such as headaches and feelings of fatigue, which underlines the importance of indoor air quality for comfort.
The monitoring results of the other apartment building in district XI show, that the average temperature in the living room was 27.4 °C during the analyzed period, and it exceeded 26 °C for more than 92% of the time. Although this building is made of brick and has undergone partial renovation, it is evident that summer overheating can still be a problem in this structure [S7]. Utilizing these monitoring results, I conducted a dynamic whole-building simulation for the building, where I used various modeling approaches. In the V1 scenario, the monitoring results were used for the analyzed apartment, while "default" values were used for the other apartments. In the V2 model, "default" values were applied to all apartments, while in V3, even the ventilation modeling was simplified. In the V1 model, there was an average deviation of only 0.91 °C compared to the measured values. In the V2 model, the average deviation was 1.13 °C, and in the V3 case, it was 1.70 °C (Figure 5). The results indicate that the calibrated model achieves greater accuracy compared to the "default" values, and the use of calibration significantly improved the accuracy of the dynamic simulations.
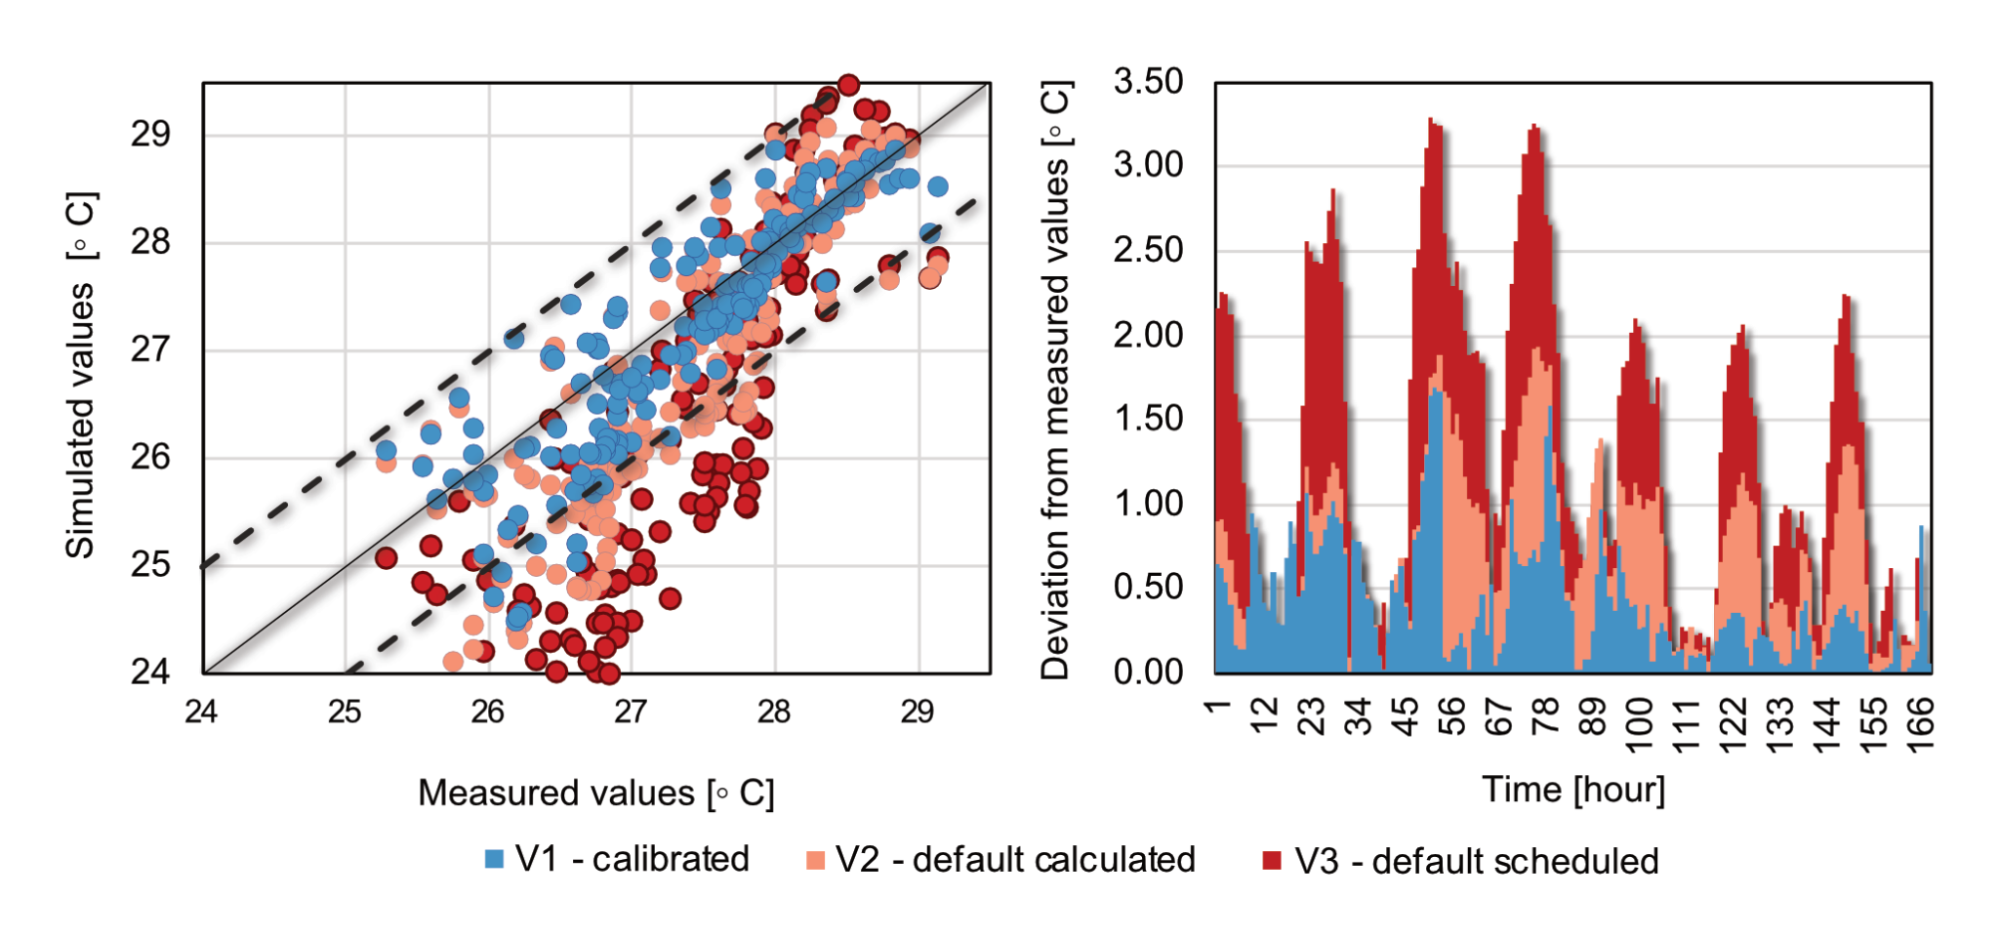
Figure 5 - Comparison of living room temperatures (measured and simulated values).
In addition to these investigations, fragility curves (Figure 6) were generated based on dynamic simulations, illustrating the overheating in different building types [S9]. The graphs reveal that the prefabricated concrete panel building (T20) is the most vulnerable when considering internal temperature limits of 26 °C and 28 °C, while the least vulnerable is the T3 detached family house. There is no clear boundary between building types. Depending on the external temperature, the way buildings warm up may vary. The steepness of the curves also provides valuable information: steeper curves indicate that the building is more sensitive to changes in external air temperature, while less steep curves indicate lower sensitivity due to the building's design. As anticipated, the panel building (T20) showed the highest vulnerability. With a daily average external temperature of 26 °C, there is approximately a 96% chance that the daily average internal temperature will exceed 26 °C and an 89% chance that it will exceed 28 °C.
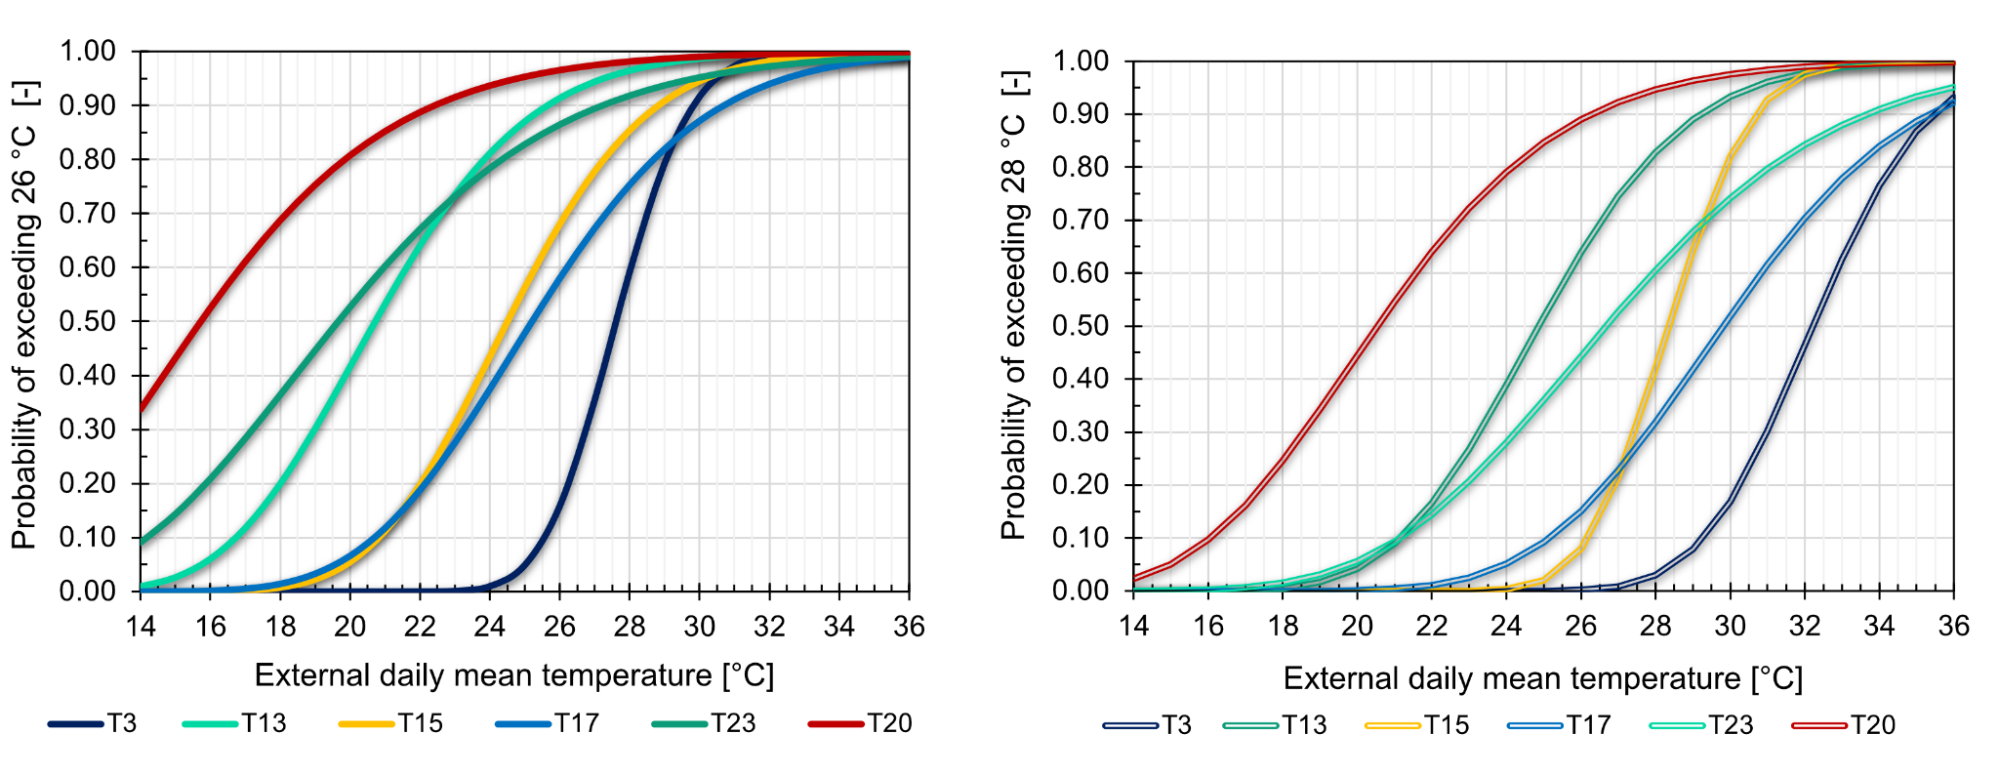
Figure 6 - Fragility curves by building type at different internal temperature limits: T3 – family house, T13 – old, small apartment building, T15 – new, small apartment building, T17 – old courtyard building, T20 – precast concrete panel building, T23 – new, large apartment building.
Expected impact and further research
This research can provide long-term real data on buildings for which we currently have a small amount of information. This allows a deeper understanding of how buildings work, as well as a refinement of the input to our dynamic simulations based on big data. In addition to the analyses mentioned earlier, it is worthwhile to explore future scenarios using dynamic simulation methods (e.g., based on IPCC RCP 4.5, RCP 8.5 [9] emission scenarios), which can provide valuable insights for developing and examining further adaptation strategies. Incorporating this detailed vulnerability analysis of buildings into large-scale studies, such as creating a Heat Vulnerability Index (HVI), can contribute to the development of more accurate indices. Moreover, it is important to conduct further research on the application and practical integration of fragility curves.
Publications, references, links
List of corresponding own publications
[S1] Szagri Dóra, Szalay Zsuzsa: Passzív technikák: Hogyan védekezzünk az épületek túlmelegedése ellen? MÉRNÖK ÚJSÁG 26: 7 pp. 24–26., 3 p. (2019)
[S2] Szagri, Dóra: Klímaváltozás és hőhullámok: Élhetők maradnak-e az épületek? ÉLET ÉS TUDOMÁNY 74: 26 pp. 810–813., 4 p. (2019)
[S3] Szagri Dóra, Nagy Balázs, Csanaky Judit Emília, Szalay Zsuzsa: Investigating Overheating of Nursing Homes to Support Heatwave Risk Analysis Methodology. YRSB19 – iiSBE Forum of Young Researchers in Sustainable Building 2019, Czech Technical University in Prague (2019) pp. 137–146., 10 p.
[S4] Szagri Dóra, Nagy Balázs, Szalay Zsuzsa: Idősotthonok felújításának kérdései a klímaváltozás tükrében. Épületeink és Műemlékeink 2019, Budapest, Hungary: Konferencia Iroda Bt. (2019) 60 p. pp. 40–46., 7 p.
[S5] Szagri Dóra, Nagy Balázs: Mitigation of the effects of heatwaves in nursing homes (2019) Poster, World Sustainable Energy Days 2019, Young Energy Researchers Conference
[S6] Szagri Dóra, Nagy Balázs, Szalay Zsuzsa: How can we predict
where heatwaves will have an impact? – A literature review on heat
vulnerability indexes. URBAN CLIMATE 52 Paper: 101711, 43 p. (2023)
[S7] Szagri Dóra, Kairlapova Ainur, Nagy Balázs, Szalay Zsuzsa: Calibration of
a summer building simulation model based on monitoring of user behaviour ACTA
POLYTECHNICA CTU PROCEEDINGS 38 Paper: 8264, 7 p. (2022)
https://doi.org/10.14311/APP.2022.38.0495
[S8] Szagri Dóra, Dobszay Bálint, Nagy Balázs, Szalay Zsuzsa: Wireless
Temperature, Relative Humidity and Occupancy Monitoring System for
Investigating Overheating in Buildings SENSORS 22: 22 Paper: 8638, 16 p.
(2022)
https://doi.org/10.3390/s22228638
[S9] Szagri, Dóra, Szalay Zsuzsa: Theoretical Fragility Curves − A Novel Approach to Assess Heat Vulnerability of Residential Buildings SUSTAINABLE CITIES AND SOCIETY 83 Paper: 103969 (2022) https://doi.org/10.1016/j.scs.2022.103969
Table of links
https://www.facebook.com/epitoanyagokesmagasepites
https://www.facebook.com/epito.bme
List of references.
[1] Cong Yin, Yaping Yang, Xiaona Chen, Xiafang Yue, Yangxiaoyue Liu, Ying Xin: Changes in global heat waves and its socioeconomic exposure in a warmer future. Climate Risk Management, Volume 38, 100459, ISSN 2212-0963, (2022) https://doi.org/10.1016/j.crm.2022.100459.
[2] Nieves Lorenzo, Alejandro Díaz-Poso, Dominic Royé: Heatwave intensity on the Iberian Peninsula: Future climate projections, Atmospheric Research, Volume 258,
105655, ISSN 0169-8095, (2021) https://doi.org/10.1016/j.atmosres.2021.105655.
[3] Bobvos, J., Málnási, T., Rudnai, T., Cserbik, D., & Páldy, A.: The effect of climate change on heat-related excess mortality in Hungary at different area levels. Időjárás Quarterly Journal Hungarian Meteorology Serv., 121(1), 43–62. (2017)
[4] Páldy, A., Kovats, S., & Hajat, S. (2005). The effect of temperature and heat waves on daily mortality in Budapest, Hungary, 1970–2000. Extreme Weather Events and Public Health Responses, (September 2015).
[5] Vicedo-Cabrera, A. M., et al.: The burden of heat-related mortality attributable to recent human-induced climate change. Nature Climate Change, 11(6), 492–500. (2021). https://doi.org/10.1038/s41558-021-01058-x
[6] "ASHRAE 140-2017 Validation Report - Building Thermal Envelope and Fabric Load Tests", (2021).
[7] CIBSE, “TM52 - The limits of thermal comfort : Avoiding overheating in European buildings,” (2013).
[8] CIBSE TM59 - Design methodology for the assessment of overheating risk in homes. Tech. Memo., 59. (2017).
[9] IPCC, 2022: Climate Change 2022: Mitigation of Climate Change. Contribution of Working Group III to the Sixth Assessment Report of the Intergovernmental Panel on Climate Change [P.R. Shukla, J. Skea, R. Slade, A. Al Khourdajie, R. van Diemen, D. McCollum, M. Pathak, S. Some, P. Vyas, R. Fradera, M. Belkacemi, A. Hasija, G. Lisboa, S. Luz, J. Malley, (eds.)]. Cambridge University Press, Cambridge, UK and New York, NY, USA. doi: 10.1017/9781009157926