
|
BMe Research Grant |

|

Baross Gábor Doctoral School for Transportation Sciences
Department of Transport Economics
Supervisor: Dr. Zoltán BOKOR
Adapting the DEA efficiency measurement method to the Hungarian logistics sector
Introducing the research area
 The linear
programming method called data envelopment analysis has been used since
more than thirty years for the efficiency evaluation of different decision
making units like bank branches [1], hospitals [2], schools [3], and within the transport sector for the efficiency analysis
of railways [4], airports [5] and ports[6]. Nevertheless, its utilization is not very widespread in
Hungary, and in the logistics sector it is very seldom applied even on
the global scale although its characteristics make it perfectly adept for this
purpose. The novelty of the present research is application and adaptation of DEA to fields where it has never been used before. The results contribute to a more
objective evaluation of the decision making units concerned.
The linear
programming method called data envelopment analysis has been used since
more than thirty years for the efficiency evaluation of different decision
making units like bank branches [1], hospitals [2], schools [3], and within the transport sector for the efficiency analysis
of railways [4], airports [5] and ports[6]. Nevertheless, its utilization is not very widespread in
Hungary, and in the logistics sector it is very seldom applied even on
the global scale although its characteristics make it perfectly adept for this
purpose. The novelty of the present research is application and adaptation of DEA to fields where it has never been used before. The results contribute to a more
objective evaluation of the decision making units concerned.
Brief introduction of the research place
 Department of Transport
Economics provides the basis for research into the overlapping fields
of transport, logistics and economics. Here engineering and economic aspects are
united with the aim of investigating transport economics and related management
issues. Besides the educational tasks, intensive national and international
research activity is conducted at the department, including numerous European projects.
Department of Transport
Economics provides the basis for research into the overlapping fields
of transport, logistics and economics. Here engineering and economic aspects are
united with the aim of investigating transport economics and related management
issues. Besides the educational tasks, intensive national and international
research activity is conducted at the department, including numerous European projects.
History and context of the research
It is of utmost importance to decision makers in the public and private sector to be aware of the efficiency of the entity they are responsible for. With the help of an envelopment surface DEA can determine which DMUs (decision making units) convert their inputs into outputs most efficiently. Its main advantage is that it does not require any a priori information about the inner relations within the DMU, i.e. the production function does not have to be determined (see Fig. 1. which shows the position of DEA in relation to other efficiency measurement techniques, based on own research [M1]). Nonetheless, the inputs and outputs representing the sector have to be selected with great care as this influences the confidence of the results.
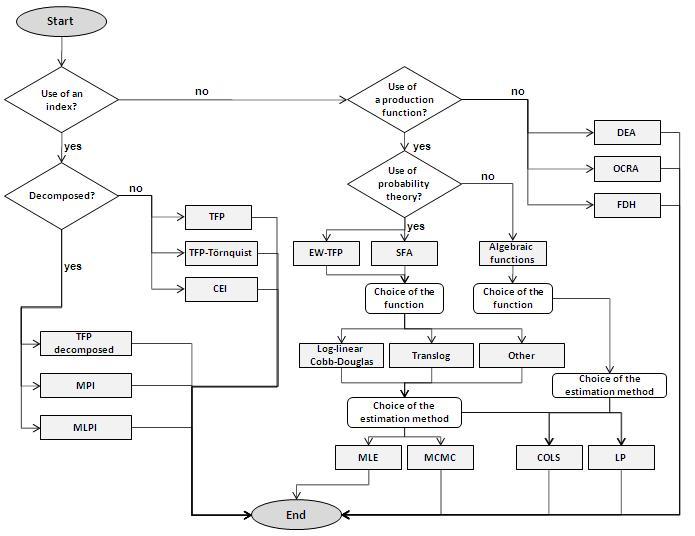
Fig. 1. Place of DEA in relation to other techniques
Due to its relative simplicity and suitability for efficiency analysis, DEA has spread very quickly after its elaboration in 1978 [7, 8], and has found numerous applications even in the transport sector alone (see Fig. 2. which shows the number of utilizations by transport modes and continents as based on own research of the literature [M2]). Surprisingly, it is not widely applied in the logistics sector, although this would be feasible and useful in multiple subfields. The aim of the present study is to close this hiatus and develop an adaptation of DEA on the logistics sector, and also answer the methodical questions encountered.
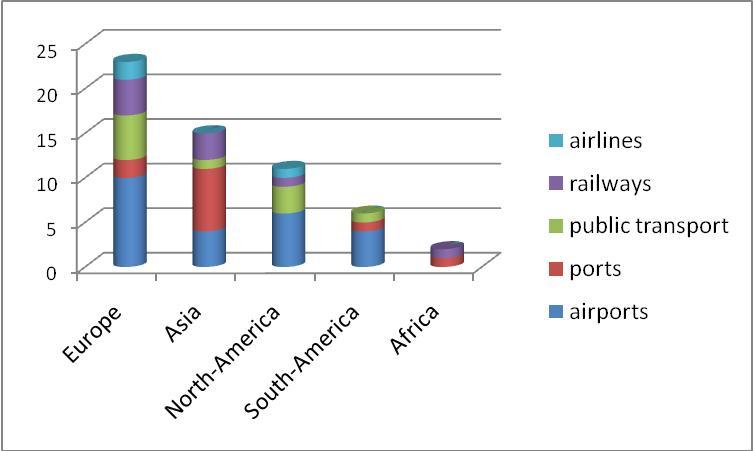
Fig. 2. The geographical and sectorial distribution of DEA studies found in the literature
The research goal, open questions
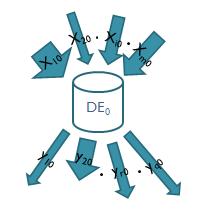
DEA can be utilized for the efficiency evaluation of any DMU that disposes of inputs and outputs (e.g. persons, firms, public institutions). Further, these inputs and outputs can have different dimensions, i.e. the efficiency evaluation of units can also include other aspects – like sustainability – beyond the financial ones. This is shown schematically in Fig. 3. which drafts the different inputs x10, x20, … xm0 and outputs y10, y20, …yq0 of DMU0, 0 being the index of DMU being analyzed.
|
|
| Fig. 3. Input/output structure of a given DMU0 |
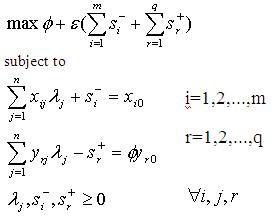
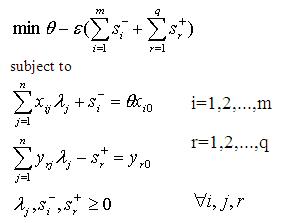
DEA is based on the Pareto definition of efficiency according to which a decision making unit is efficient if none of its inputs can be decreased without decreasing any of its outputs (or reversed, none of its outputs can be increased without increasing any of its inputs). Formulating this mathematically, applying the duality theorem of linear programming and the Charnes-Cooper transformation, the envelopment formula can be created (see Table 1., where – l: weights; f: output oriented efficiency, θ: input oriented efficiency, s: slacks, ε: non-Archimedean element). This is the standard form of DEA that can be stated in an input and output oriented version as well [9]. The first equation is the objective function while the rest show the limiting conditions.
Tab. 1. Envelopment models of DEA
|
Output oriented case |
Input oriented case |
|
|
Note that decision making units may also be persons or a group of persons, not merely economic entities, therefore, the first step in our research is to reveal in which area of logistics can DEA be applied best. A further topic is the determination of the input/output structure which can be regarded as the most important step of the adaptation. Further to the investigation of emerging methodical questions, the method will also be applied in practice.
Methodology
The adaptation of DEA in logistics was prepared by two sub researches. First, the logistics sector was analyzed to identify the best candidate fields in terms of DEA implementation. It has been found that the technique could be utilized for the appraisal of logistics companies (carriers, forwarders and 3PL firms), terminals (logistic centres), different regions/countries and – with some limitations – supply chains (see Fig. 4.). [M12] The DEA technique is almost exclusively referred to by Chinese authors in relation with logistics. It is mainly used to analyze the logistics potential of geographic regions [10, 11] or the efficiency of logistic companies. Note however, that the latter do not leverage the advantages inherent to DEA (e.g. the evaluation is carried out solely on the basis of financial indicators) [12, 13].
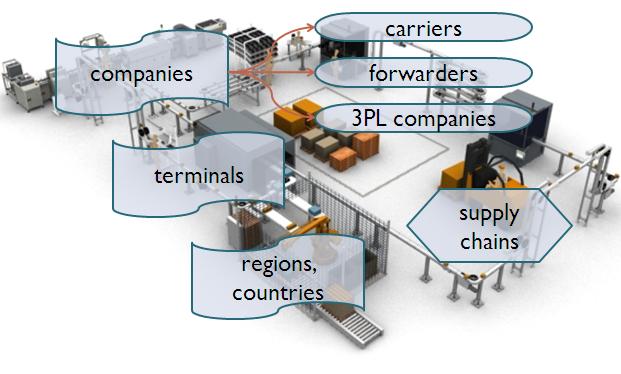
Fig. 4. The options for applying DEA in the logistics sector
With this in mind and knowing the data available, efficiency analysis of Hungarian logistic centres with the DEA-technique has become the first objective of our research. Investigating the literature and the method more closely, a methodical question has also arisen which is to be answered in the framework of theoretical research. It is a well known feature of DEA that it can not provide a full ranking of the decision making units although this would be preferred in most cases. Feasibility of full ranking requires methodological research to see how they can be adapted to our needs and especially, to cases where data availability is limited.
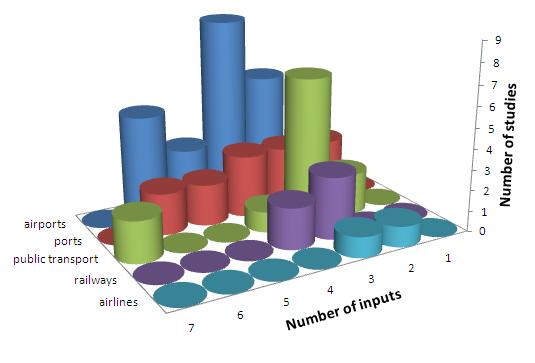
Fig. 5. The distribution of the number of inputs in various transport sectors
The other preparatory sub research for logistics adaptation was a profound investigation of related literature to determine the optimal input/output structure. Altogether 69 applications of DEA [like 5, 6, 14, 15] in the transport sector have been analyzed to scrutinize the inputs and outputs employed. [M2] Not only their numbers and distribution (see Fig. 5. and 6.) but their content has also been evaluated. The latter led us to conclude that in the transport sector, inputs generally come from the cluster of financial costs, labour indicators and operational costs, while the outputs are derived from the cluster of operational and financial results.

Fig. 6. The distribution of the number of inputs in various transport sectors
Results
During the adaptation to logistic centres, the first objective was to carry out the examinations with as many inputs and outputs as possible based on the available data, on previous research, and on methodological considerations. In all three DEA setups we have tested, the input were the office area, the number of employees and the area of available storage space (excluding external storage facilities). The outputs have been changed in the course of the examination: in the first round it was the total sales revenue, next the tons handled, and in the third test, with methodological awareness, both together were included in the investigation. Results have shown which of the enterprises can be regarded efficient both from financial and technical perspective and which could improve their performance by better translating operational achievements into financial results (see Fig. 7. indicating the efficiency results for the third setup. Efficient firms are characterized by an efficiency value of 1, while the rest received a value between 0 and 1.). [M5]
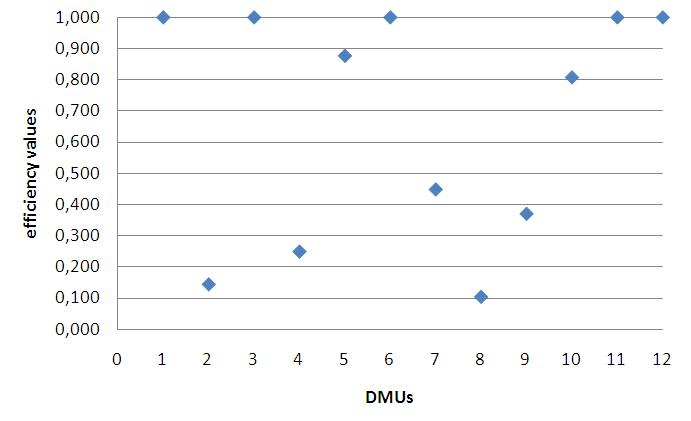
Fig. 7. Example of the resulting
efficiency scores
(variable returns to scale efficiency)
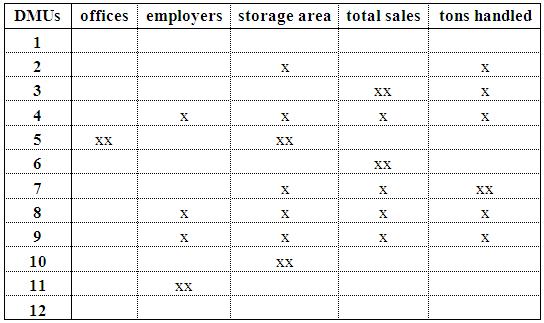
Once it has become clear from the applications that DEA can be adapted to logistic centres, the focus of investigations has been shifted to sensitivity analysis of the method (second stage of research). Our objective was to determine the extent of robustness and reliability of the created input/output structure. For this reason, inputs and outputs have ceteris paribus been excluded one by one from the original DEA setup. The results matched very well with the expectations: office area, as a less influential factor on the operation of logistics centres, has basically not affected the efficiency score very much while the size of storage area and total sales revenue proved to be important factors. (See Table 1. showing the dependence of the efficiency value of different DMUs on various inputs/outputs – 'xx' denotes a strong connection, i.e. where the given input/output alters the efficiency score by at least 0.5; while ‘x’ refers to a weaker connection with an efficiency value change below 0.5). [M8]
Tab. 2. Results of the sensitivity analysis
Methodical questions have also been answered in the course of adaptation. A new method was created, basically a combination of DEA and AHP as based on the work of [16]. Using the new technique, the pairwise comparison of decision making units is carried out with DEA methodology without setting a limit on the resulting efficiency value. The ensuing scores are then utilized to build a pairwise but nonreciprocal comparison matrix which serves as the basis of the AHP investigation. Main advantage of this new method is the wider range of the resulting efficiency values which subsequently lead to better distinction between the DMUs in the AHP process. [M13]
Expected impact and further research
The number of studies applying DEA in the field of logistics is very low even globally. Thus, the research presented above entails a high rate of novelty, especially since DEA and the related methods (e.g. AHP) are widely applied and referred to in the international literature and new results in this field are expected to be well received by journals of high standing. The new method combining DEA and AHP has especially to be mentioned as one offering a new efficiency ranking method to decision makers.
Planned future research includes the
exploitation of DEA in further fields of logistics, e.g. in that of the
investigation of the logistic potential of European regions; and also pilot
applications parallel with its peer method, stochastic
frontier analysis.
Publications, references, links
List of own publications:
Reviewed journals published abroad in English:
Reviewed national journals in English:
Reviewed national journals:
Conference proceedings in Hungarian:
Budapest University of Technology and Economics
Department of Transport Economics
The Centre for Efficiency and Productivity Analysis
Full list of references (self-compiled)
References:
-
Barros, C.P.. Airports in Argentina (2008). Technical efficiency in the context of an economic crisis. Journal of Air Transport Management 14. pp. 315–319.
- Tongzon, J. (2001). Efficiency measurements of selected Australian and other international ports using data envelopment analysis. Transportation Research Part A 35, pp. 107–122.
- Charnes, A., Cooper, W.W.; Rhodes, E. (1978). Measuring the efficiency of decision making units. European Journal of Operational Research 2, pp. 429–444.
- Farrel, M.J. (1957). The measurement of productive efficiency. Journal of Royal Statistical Society A 120, pp. 253–281.
- Cooper, W.W.; Seiford, L.M.; Zhu, J. (2004). Handbook on Data Envelopment Analysis. International Series in Operations Research & Management Science, Vol. 71. ISBN: 978-1-4020-7797-5.
- Jiang, C; Fu, P. (2009). Evaluating Efficiency and Effectiveness of Logistics Infrastructure Based on PCA-DEA Approach in China. Second International Conference on Intelligent Computation Technology and Automation Vol. 3. pp. 62–66.
- He, Z.; Sun, L.; Wang, Y.; Zhu, C. (2006). Empirical study on efficiency of regional freight logistics in China. International Journal of Logistics Systems and Management, Vol. 2. No. 3. pp. 302–320.
- Shen, Y– Chen, Y. (2008). Empirical Study on Performance Assessment of Listed Logistics Companies in China with DEA. Proceedings of the Eighth International Conference of Chinese Logistics and Transportation Professionals pp. 712–719
- Liu, Y.– Wu, Y. (2007). Empirical analysis on TFP change in Chinese logistics industry: A nonparametric Malmquist index approach. Chinese Business Review, 6/4 pp. 35–40. ISNN1537-1506.
- Hirschhausen, C.V.– Cullmann, A. (2010). A nonparametric efficiency analysis of German public transport companies. Transportation Research Part E 46, pp. 436–445.
- Pina, V.; Torres L.: (2001). Analysis of the efficiency of local government services delivery. An application to urban public transport. Transportation Research Part A 35. pp. 929–944.
- Sinuany-Stern, Z.; Mehrez, A.; Hadad, Y. (2000). An AHP/DEA methodology for ranking decision making units. International Transactions in Operational Research, 7. pp. 109 – 124.
- Duleba,Sz (2008) . Hungarian Characteristics of Logistics Trends in the
FMCG Sector. In: Economics and Organization of Enterprise Vol. LIX May, pp. 43–51, Poland ISSN 0860-6846.