|
|
BMe Research Grant |
|

NAGY Marcell
BMe Research Grant - 2023
IIIrd Prize
![]()
Doctoral School of Mathematics and Computer Science
TTK, Department of Stochastics
Supervisor: Dr. SIMON Károly, Consultant: Dr. MOLONTAY Roland
Interpretable Dropout Prediction: Towards XAI-Based Personalized Intervention
Introducing the research area
Student dropout prediction belongs to a relatively new research area, called educational data science. Educational data science is an important branch of data science that aims to extract knowledge from various forms of massive educational data using statistical and machine learning methods. In cooperation with the Central Academic Office of BME, we aim to assist educational stakeholders by providing a better understanding of the big data stored in the educational administrative system, called Neptun. My main research area includes identifying students at risk of dropping out, assessing the predictive validity of the university entrance score, and identifying various factors of student success using explainable artificial intelligence.
Brief introduction of the research place
Educational data science is one of the main research areas of the Human and Social Data Science Lab. The mission of the lab is to translate fundamental research in data and network science into a lasting impact in the social, human, policy, and business contexts. We also collaborate with the EduDev company in a research and development project, to utilize our findings and solutions and make them publicly available as an AI-based application.
History and context of the research
Student drop-out is among the most burning issues in STEM (science, technology, engineering, and mathematics) higher education, which induces considerable social and economic costs. Using machine learning tools to identify students at risk of dropping out has gained a lot of interest recently [1-5].
While the vast majority of dropout prediction studies use machine learning algorithms to classify future university dropouts and graduates as accurately as possible, the interpretation of the trained models and the explanations of their predictions are usually neglected. However, besides having a machine learning model with a high classification performance, a well-functioning decision support system also helps in explaining why a certain prediction was output and what intervention should be performed to help the individual.
In this research, using the data from the Budapest University of Technology and Economics, we demonstrate how interpretable machine learning (IML), and explainable artificial intelligence (XAI) tools can support educational stakeholders in dropout prediction.
IML and XAI methods make black-box models transparent, making it possible to provide personalized guidance, remedial courses, and tutoring sessions for students. Moreover, explaining the predictions and interpreting the results also help in establishing the trust of decision-makers which are key steps towards deploying these solutions in real education environments.
The research goals, open questions
While the related works predict students’ grade point average and performance in specific courses, in this research, the output (target) variable is the final academic performance of an undergraduate student, i.e., we aim to distinguish between students expected to graduate and students at risk of dropping out [MN1]. The main research goals of this work are as follows:
- Using the information available at the time of application/enrollment to the university, predict the final university performance (dropout/graduate). In other words, identify students at risk of dropping out using machine learning.
- Interpret the machine learning model both globally and locally. First, we identify the most influential features and study their impact on the model’s output. Then, in contrast to the majority of the related works [6-7], we provide local explanations of the predictions, i.e., we study the reasons behind individual predictions: why a student is at risk?
Methods
This study is based on data from the Budapest University of Technology and Economics (BME), which contains 8,508 records of students who enrolled between 2013 and 2017 and have since finished their undergraduate studies either by graduation or dropping out. The features of our data set are mostly those pre-enrollment achievement measures that are used to calculate the composite university entrance score (UES) on what the student’s admission is based on [MN2]. More precisely, we have data on their high school grades and their scores on the high school leaving exam, called matura. High school performance is measured by the high school grade point average (HSGPA). The matura-related features consist of scores in exams in different subjects, such as history and mathematics.
For making predictions on final academic performance, we use the CatBoost algorithm, which achieves state-of-the-art results on several tabular benchmark data sets [8], where the most recent deep learning models are underperforming compared to tree-based models [9-10].
For model interpretation, we use modern techniques such as two-dimensional partial dependence plots [11], and SHapley Additive exPlanations (SHAP) values [12], that is based on the game-theoretical concept of Shapley value.
Partial dependence plots (PDP) are used for global interpretation. Also called an interaction diagram, a PDP reveals the relationship between features, namely, it shows the effect of two features on the model’s output while holding other features constant [11].
For local interpretations, i.e., a more detailed understanding of individual predictions, we use SHAP values, which provide a measure of the contribution of each feature to a specific prediction. In particular, the contribution of the features is compared to the average output (prediction) of the model, which is called the base value. Hence, it explains an individual prediction by showing how and to what extent the features are moving the model’s output relative to the base value [12]. By aggregating these values, we can also obtain global importance for each feature.
Results
We have tested several machine learning models and have found that CatBoost performed the best with an average precision of 0.847 and AUC of 0.774. Our results align with the related studies on dropout prediction on a large heterogeneous data set (e.g., Behr et al [13] achieved an AUC of 0.77, and the average precision reported by Lee and Chung [14] is 0.898). Thus, our model accurately identifies at-risk students, making it worth interpreting the model using the tools of XAI.
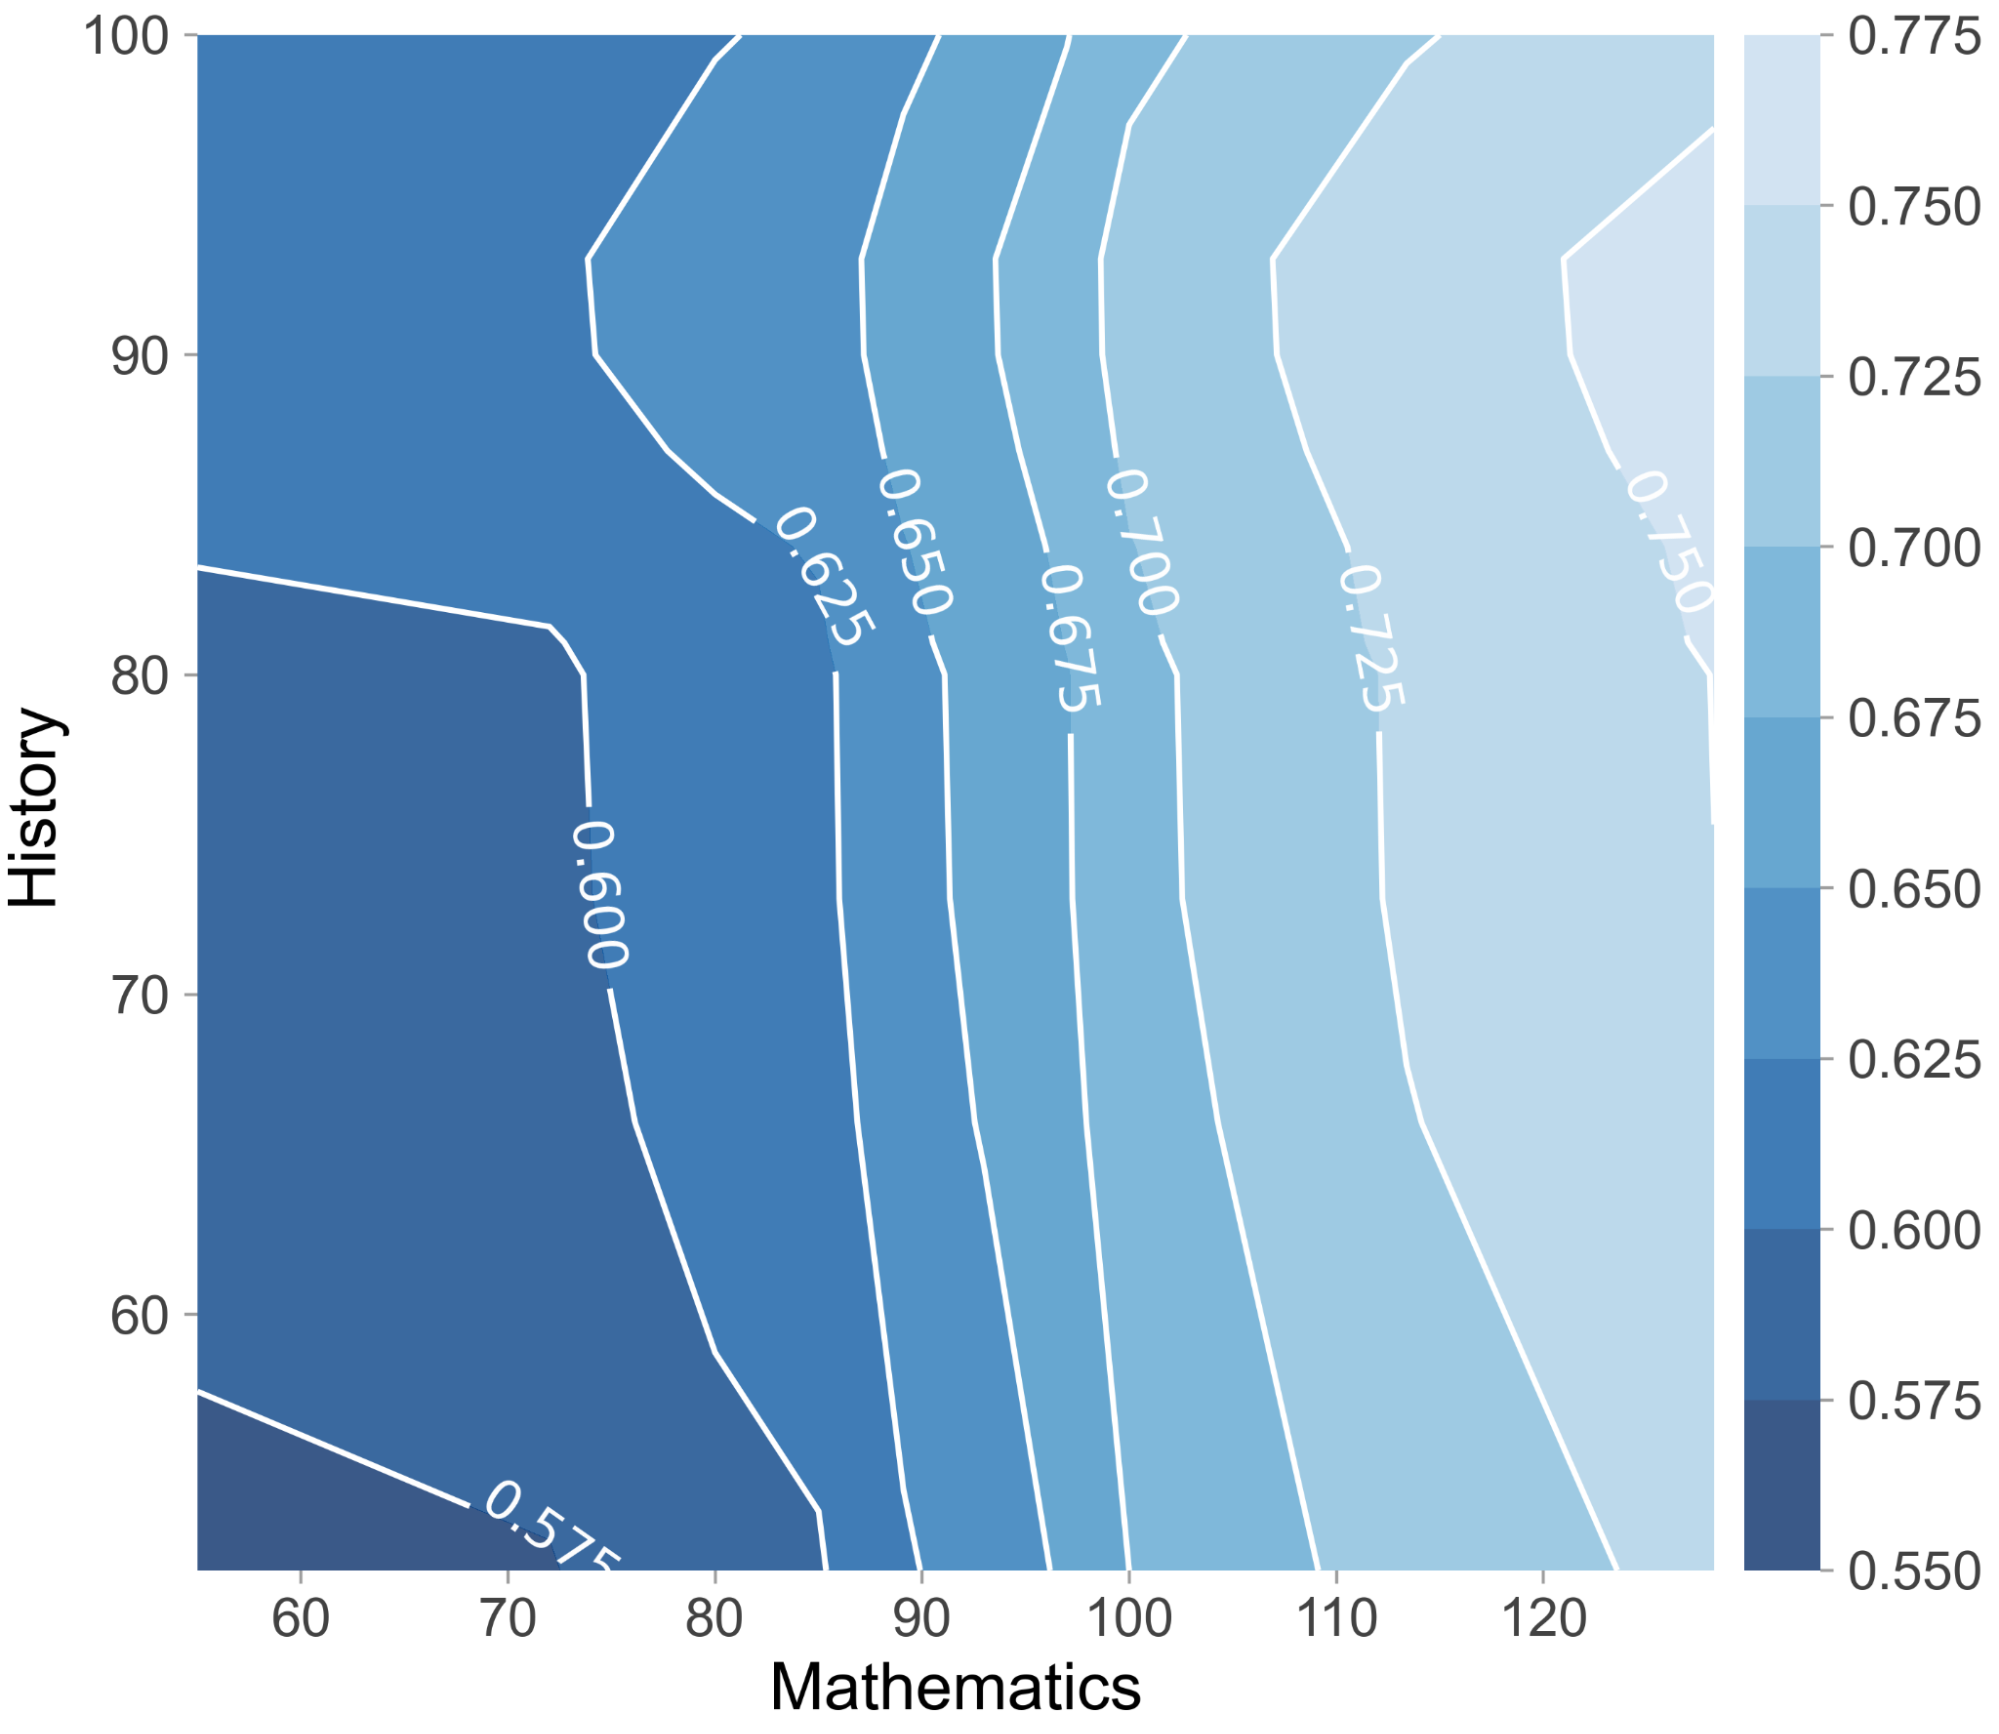
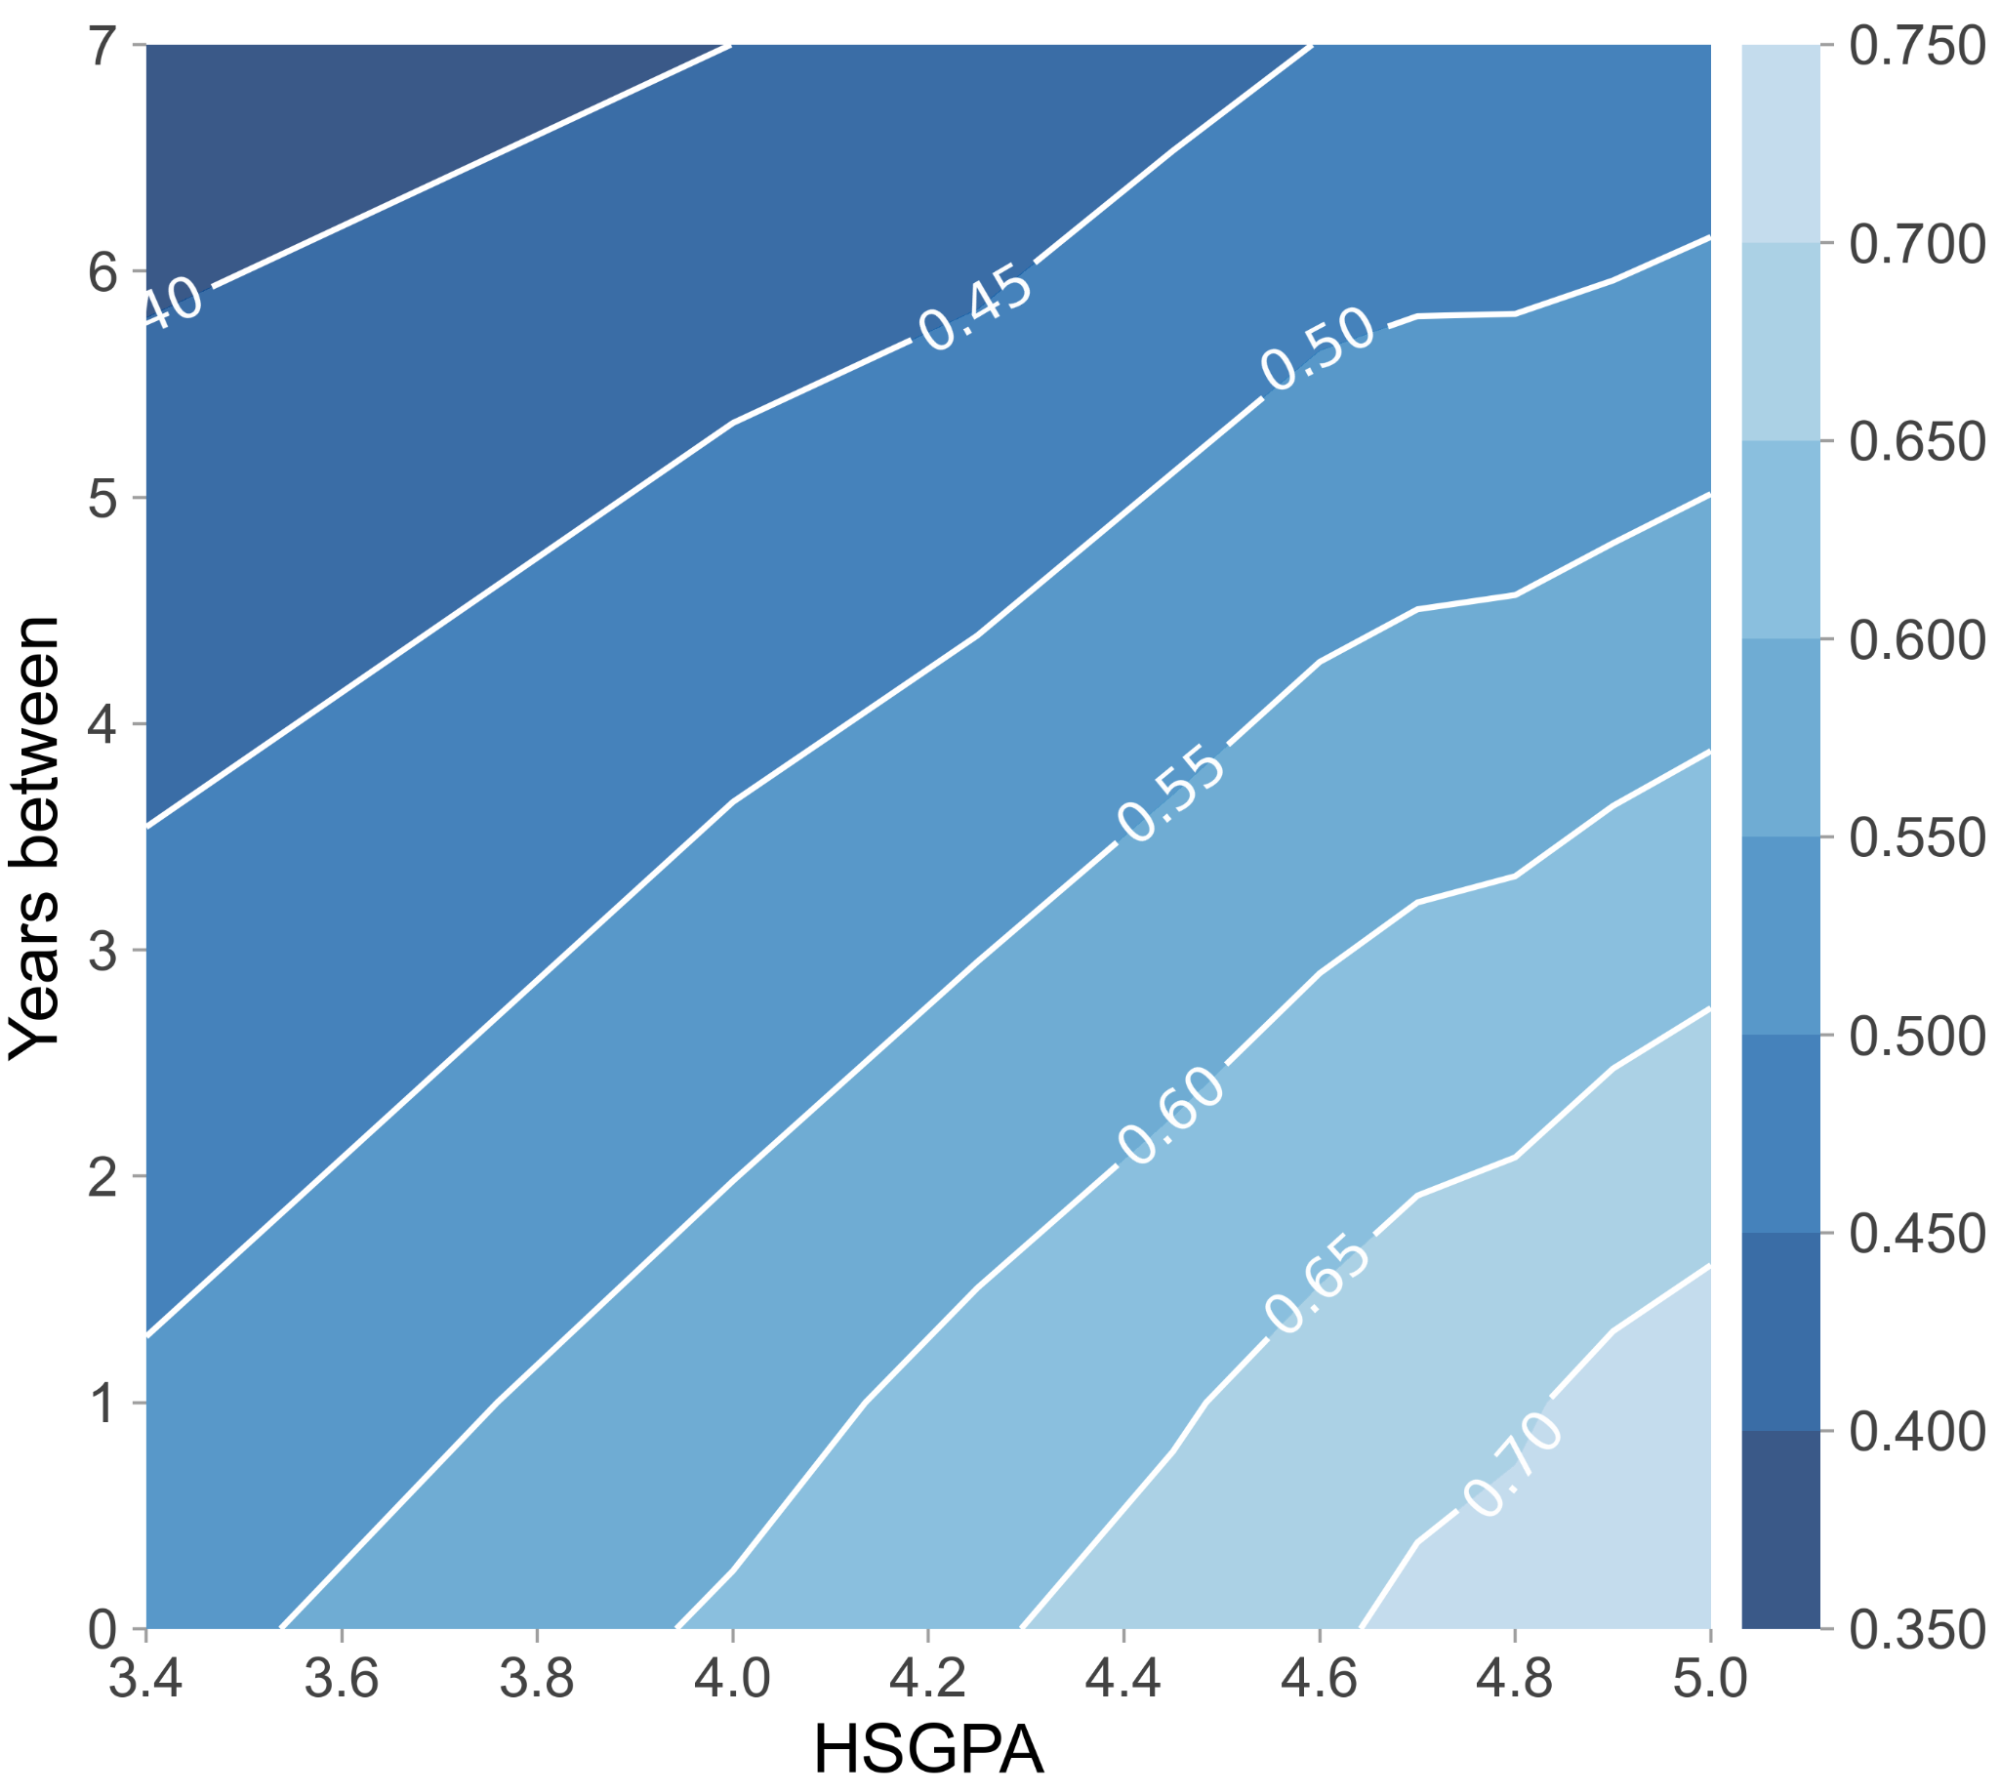
Figure 1. Two-dimensional partial dependence plot of mathematics with history and the interaction of HSGPA with Years between (number of years elapsed between high school graduation and university enrollment).
To understand the joint impact of features on the prediction, we turn to two-dimensional partial dependence plots. The left plot in Figure 2 shows the predictions for any combination of mathematics and history matura exam scores. The CatBoost model’s output increases with higher scores in mathematics, moreover, the highest probability of graduation can be achieved if the score in history is also relatively high. On the other hand, if one has an outstanding score in mathematics and a too-high score in history, the predicted probability of graduation slightly decreases. The right plot in Figure 2 suggests that if senior high school students do not start their university studies right after graduation, then their chances of obtaining a degree decrease over the years. Moreover, students are more likely to graduate if they have excellent grades in high school.
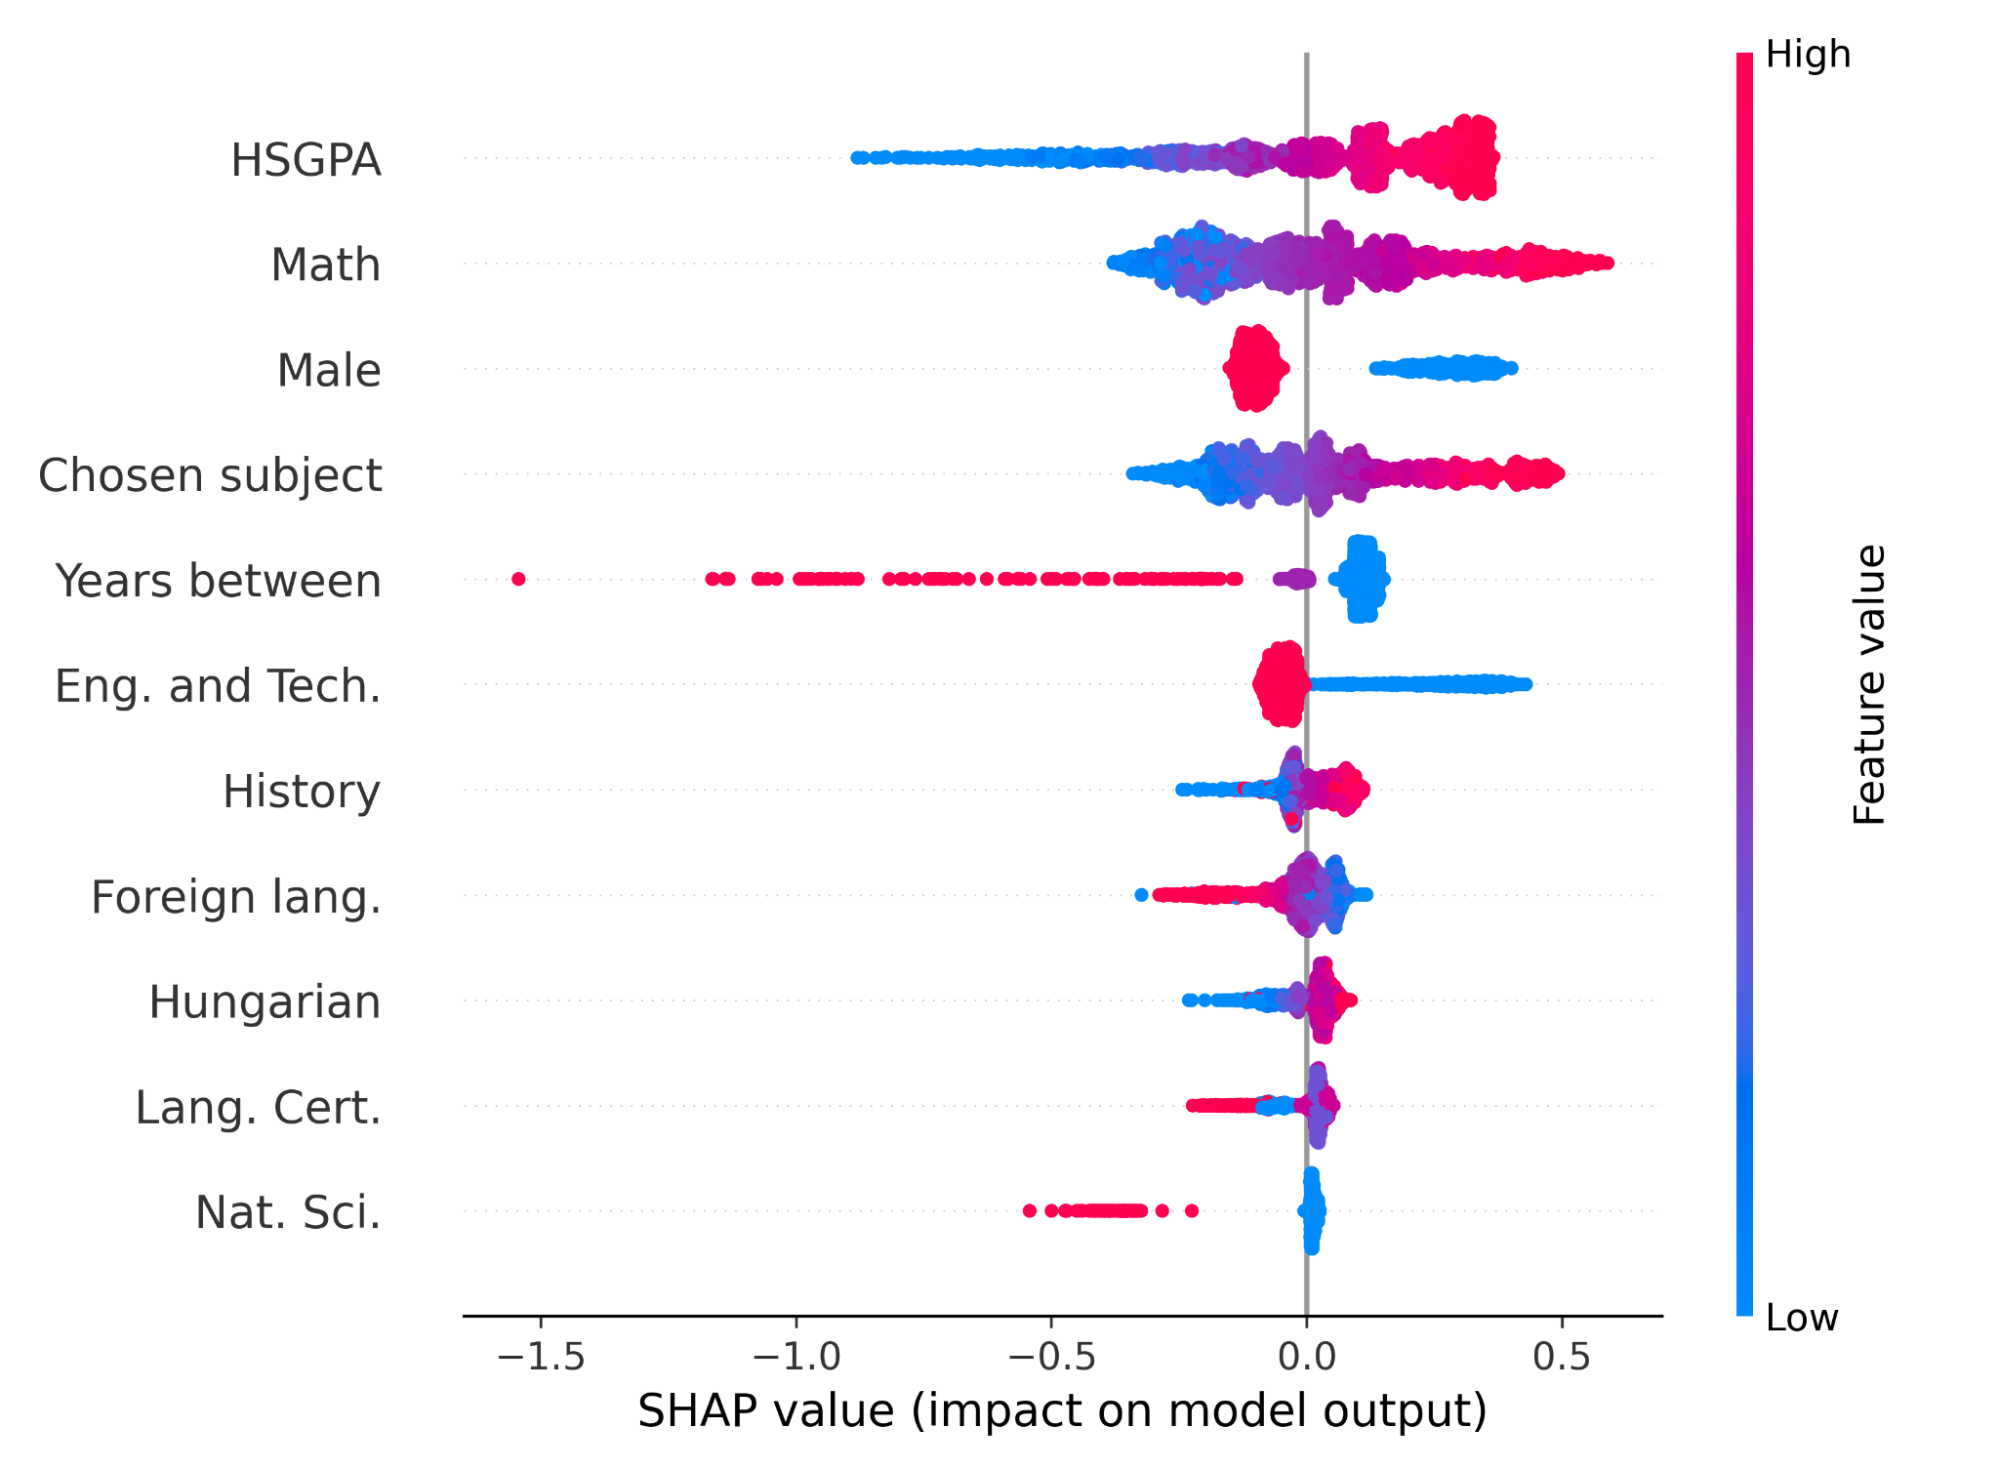
Figure 2. SHAP summary plot. Each student is represented with one point in each row. The points are colored by the value of the corresponding feature and the x-axis shows the impact on the model’s prediction. The features are ordered by their importance (average absolute impact on the model output).
Figure 2 illustrates the impact of the features on the model’s output according to the SHAP technique. The plot indicates that the most important variable is the HSGPA, and the higher the HSGPA is, the more likely the graduation is. Since the examined university is a technical university, it is not so surprising that math skill is a great predictor of final academic success. There is a similar relationship between the chosen subject and the probability of graduation. This is probably due to the fact that in the admission system, the chosen subject mostly has to be related to the field of study. We can observe, as shown in Figure 3 being male has a negative effect on the model output. That is in alignment with our earlier work [NM2], where we have shown that female students are more likely to graduate from BME than males.
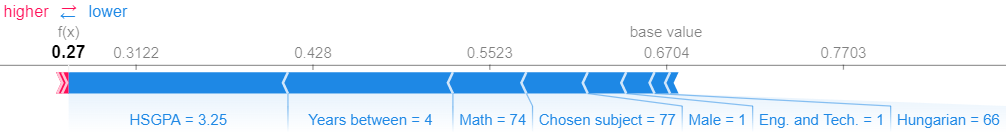

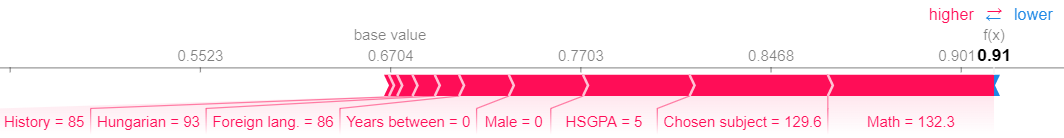
Figure 3. Force plots of explanations of the individual predictions for three students using the SHAP values. The base value – the average prediction – is 0.67. The features pushing higher the model output from the base value are shown in red, and the features decreasing the prediction are in blue. The length of the bars corresponds to the contribution of the feature.
Figure 3 shows four examples of individual explanations of predictions using SHAP values. For the first student, the estimated probability of graduation is 0.27, which means that this student is at high risk of dropout, however, the SHAP values also tell us why. Nothing pushes the prediction higher, but the fact that 4 years have elapsed between high school and university and that the mathematics score and the HSGPA are relatively low, significantly decreases the model’s prediction. The second example shows a borderline student. The student’s score in the chosen subject is high, but the low score in math pushes the prediction lower and it “cancels out” the positive effect. The last example demonstrates a smart student with excellent HSGPA and matura scores, moreover, the fact that females are more likely to graduate also pushes the probability of graduation higher.
Expected impact and further research
The novelty of our approach lies in the fact that we not only estimate the probability of graduation and provide global interpretation but also explain the individual predictions, which can serve as a decision-support tool for all stakeholders. For instance, predictions can guide high school students in selecting the right university major and offer career guidance based on their high school performance indicators for optimal success. It can also help both high school and university students in identifying the skills that need to be improved to succeed in their university studies. Furthermore, it can be also helpful for decision-makers in higher education in choosing the right action plan for at-risk students, by offering them personalized tutoring and remedial courses.
Soon these methods will be deployed in a publicly available application which we are developing together with the Educational Development company.
Publications, references, links
List of corresponding own publications.
[MN1] Nagy, M., & Molontay, R. (2023). Interpretable Dropout Prediction: Towards XAI-Based Personalized Intervention. International Journal of Artificial Intelligence in Education, 1–27.
[MN2] Nagy, M., & Molontay, R. (2021). Comprehensive analysis of the predictive validity of the university entrance score in Hungary. Assessment & Evaluation in Higher Education (pp. 1–19)
[NM3] Baranyi, M., Nagy, M., & Molontay, R. (2020). Interpretable deep learning for university dropout prediction. Proceedings of the 21st Annual Conference on Information Technology Education (pp. 13–19)
[NM4] Molontay, R., & Nagy, M. (2022). How to improve the predictive validity of a composite admission score? a case study from Hungary. Assessment & Evaluation in Higher Education (pp. 1–19)
[NM5] Nagy, M., Molontay, R., & Szabó, M. (2019). A web application for predicting academic performance and identifying the contributing factors. 47th Annual Conference of SEFI (pp. 1794–1806)
[NM6] Nagy, M., & Molontay, R. (2018). Predicting dropout in higher education based on secondary school performance. In 2018 IEEE 22nd International Conference on Intelligent Engineering Systems (INES) (pp. 389–394). IEEE.
[NM7] Kiss, B., Nagy, M., Molontay, R., & Csabay, B. (2019). Predicting dropout using high school and first-semester academic achievement measures. In 2019 17th International Conference on Emerging eLearning Technologies and Applications (ICETA) (pp. 383–389). IEEE.
[NM8] Nagy, M. (2023). Lemorzsolódás előrejelzése személyre szabott értelmezhető gépi tanulási módszerek segítségével. Scientia et Securitas, 3(3), 270–281.
Table of links.
BME Human and Social Data Science Lab
List of references.
[1] Alyahyan, E., & Düştegör, D. (2020). Predicting academic success in higher education: literature review and best practices. International Journal of Educational Technology in Higher Education, 17(1), 1–21.
[2] Helal, S., Li, J., Liu, L., Ebrahimie, E., Dawson, S., & Murray, D. J. (2019). Identifying key factors of student academic performance by subgroup discovery. Int J Data Sci Anal, 7(3), 227–245.
[3] Márquez-Vera, C., Cano, A., Romero, C., Noaman, A. Y. M., Mousa Fardoun, H., & Ventura, S. (2016). Early dropout prediction using data mining: a case study with high school students. Expert Systems, 33(1), 107–124.
[4] Rovira, S., Puertas, E., & Igual, L. (2017). Data-driven system to predict academic grades and dropout. PLoS One, 12(2), e0171207.
[5] Varga, E. B., & Sátán, Á. (2021). Detecting at-risk students on computer science bachelor programs based on pre-enrollment characteristics. Hungarian Educational Research Journal, 3(11), 297–310.
[6] Mingyu, Z., Sutong, W., Yanzhang, W., & Dujuan, W. (2021). An interpretable prediction method for university student academic crisis warning. Complex & Intelligent Systems, 8, 1–14.
[7] Karlos, S., Kostopoulos, G., & Kotsiantis, S. (2020). Predicting and interpreting students’ grades in distance higher education through a semi-regression method. Applied Sciences, 10(23), 8413.
[8] Prokhorenkova, L., Gusev, G., Vorobev, A., Dorogush, A. V., & Gulin, A. (2018). Catboost: unbiased boosting with categorical features. Proceedings of the 32nd International Conference on Neural Information Processing Systems (NeurIPS’18) (pp. 1–11)
[9] Grinsztajn, L., Oyallon, E., & Varoquaux, G. (2022). Why do tree-based models still outperform deep learning on typical tabular data? In: Thirty-sixth Conference on Neural Information Processing Systems Datasets and Benchmarks Track.
[10] Shwartz-Ziv, R., & Armon, A. (2022). Tabular data: Deep learning is not all you need. Inform Fusion, 81, 84–90.
[11] Greenwell, B. M., Boehmke, B. C., McCarthy, A. J. (2018). A simple and effective model-based variable importance measure. arXiv preprint arXiv:180504755.
[12] Lundberg, S. M., & Lee, S. I. (2017). A unified approach to interpreting model predictions. In I. Guyon, U. V. Luxburg, S. Bengio, H. Wallach, R. Fergus, S. Vishwanathan, & R. Garnett (Eds.), Advances in Neural Information Processing Systems 30 (pp. 4765–4774).
[13] Behr, A., Giese, M., Theune, K., et al. (2020). Early prediction of university dropouts – a random forest approach. Jahrbücher Für Nationalökonomie Und Statistik, 240(6), 743–789.
[14] Lee, S., & Chung, J. Y. (2019). The machine learning-based dropout early warning system for improving the performance of dropout prediction. Applied Sciences, 9(15), 3093.